Automate Your Project Timeline Directly in Microsoft Excel
Stop manually drawing shapes, adjusting cell backgrounds, or debugging brittle grid-formulas. Our native desktop Excel-based app connects an intuitive data grid directly to a high-performance visual calculation engine.
Simply insert a task list table, and watch your project plan draw itself instantly on the spreadsheet. Because it lives within the Excel environment, you retain complete file ownership and interoperability while losing the friction of static, manual updates.
- Instant Timeline SynchronizationEditing row dates or text triggers instant chart updates.
- One-click to Apply Theme TemplatesEasily change the theme or apply your own business and brand colors.
- Easy for Sharing and CooperationExport in PDF or PNG format, or copy directly to Word as a native Microsoft 365 object.
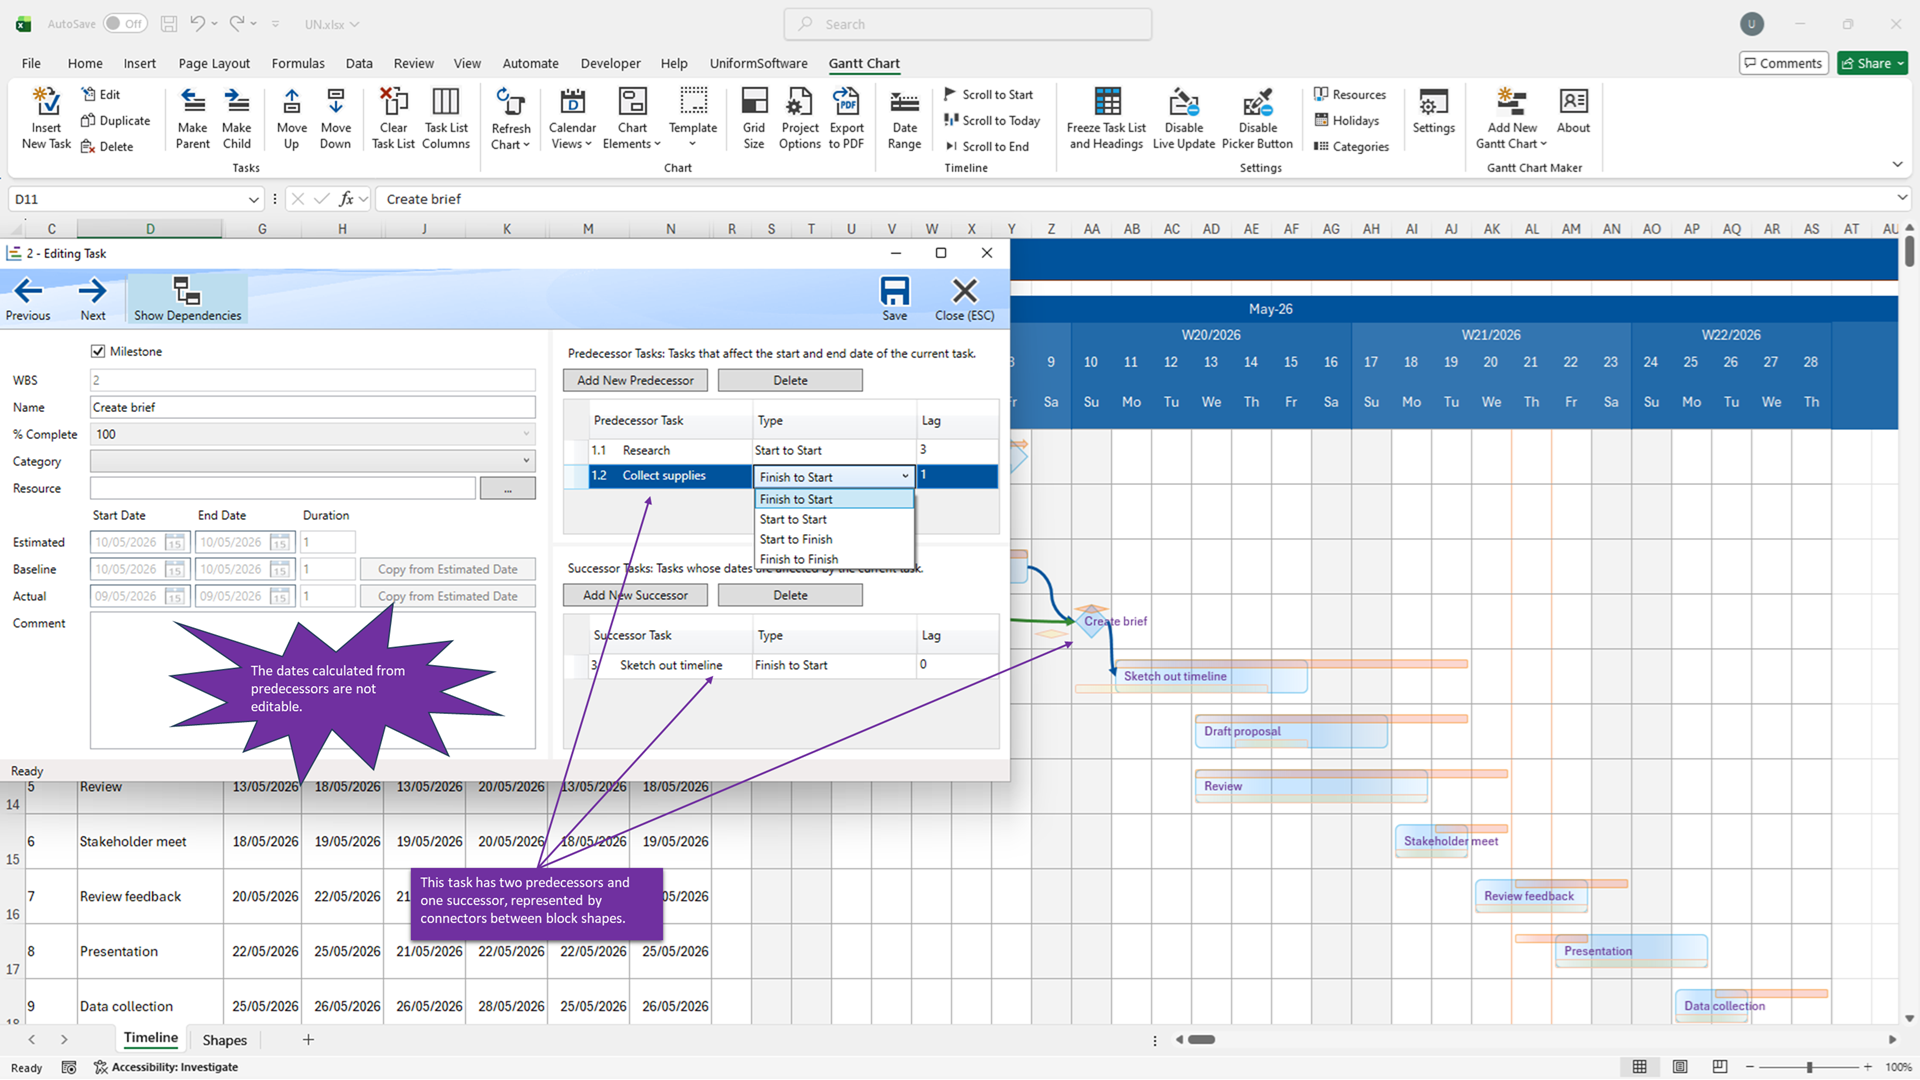
Advanced Task Dependencies & Cascading Schedule Adjustments
Manage real-world project relationships like an enterprise coordinator without leaving your `.xlsx` files.
Our built-in, dedicated Task Editor window gives you granular control over complex project relationships. Link predecessor and successor tasks with ease—when an upstream delivery gets delayed, all dependent downstream workflows shift automatically across your timeline sheet.
- Predecessor & Successor RulesPrevent manual scheduling overlap by chaining linked rows.
- Automated Forward Pass CalculationsChanges safely cascade across the entire structural network.
- Critical Path VisualizationSpot tracking bottlenecks immediately before they stall deployments.
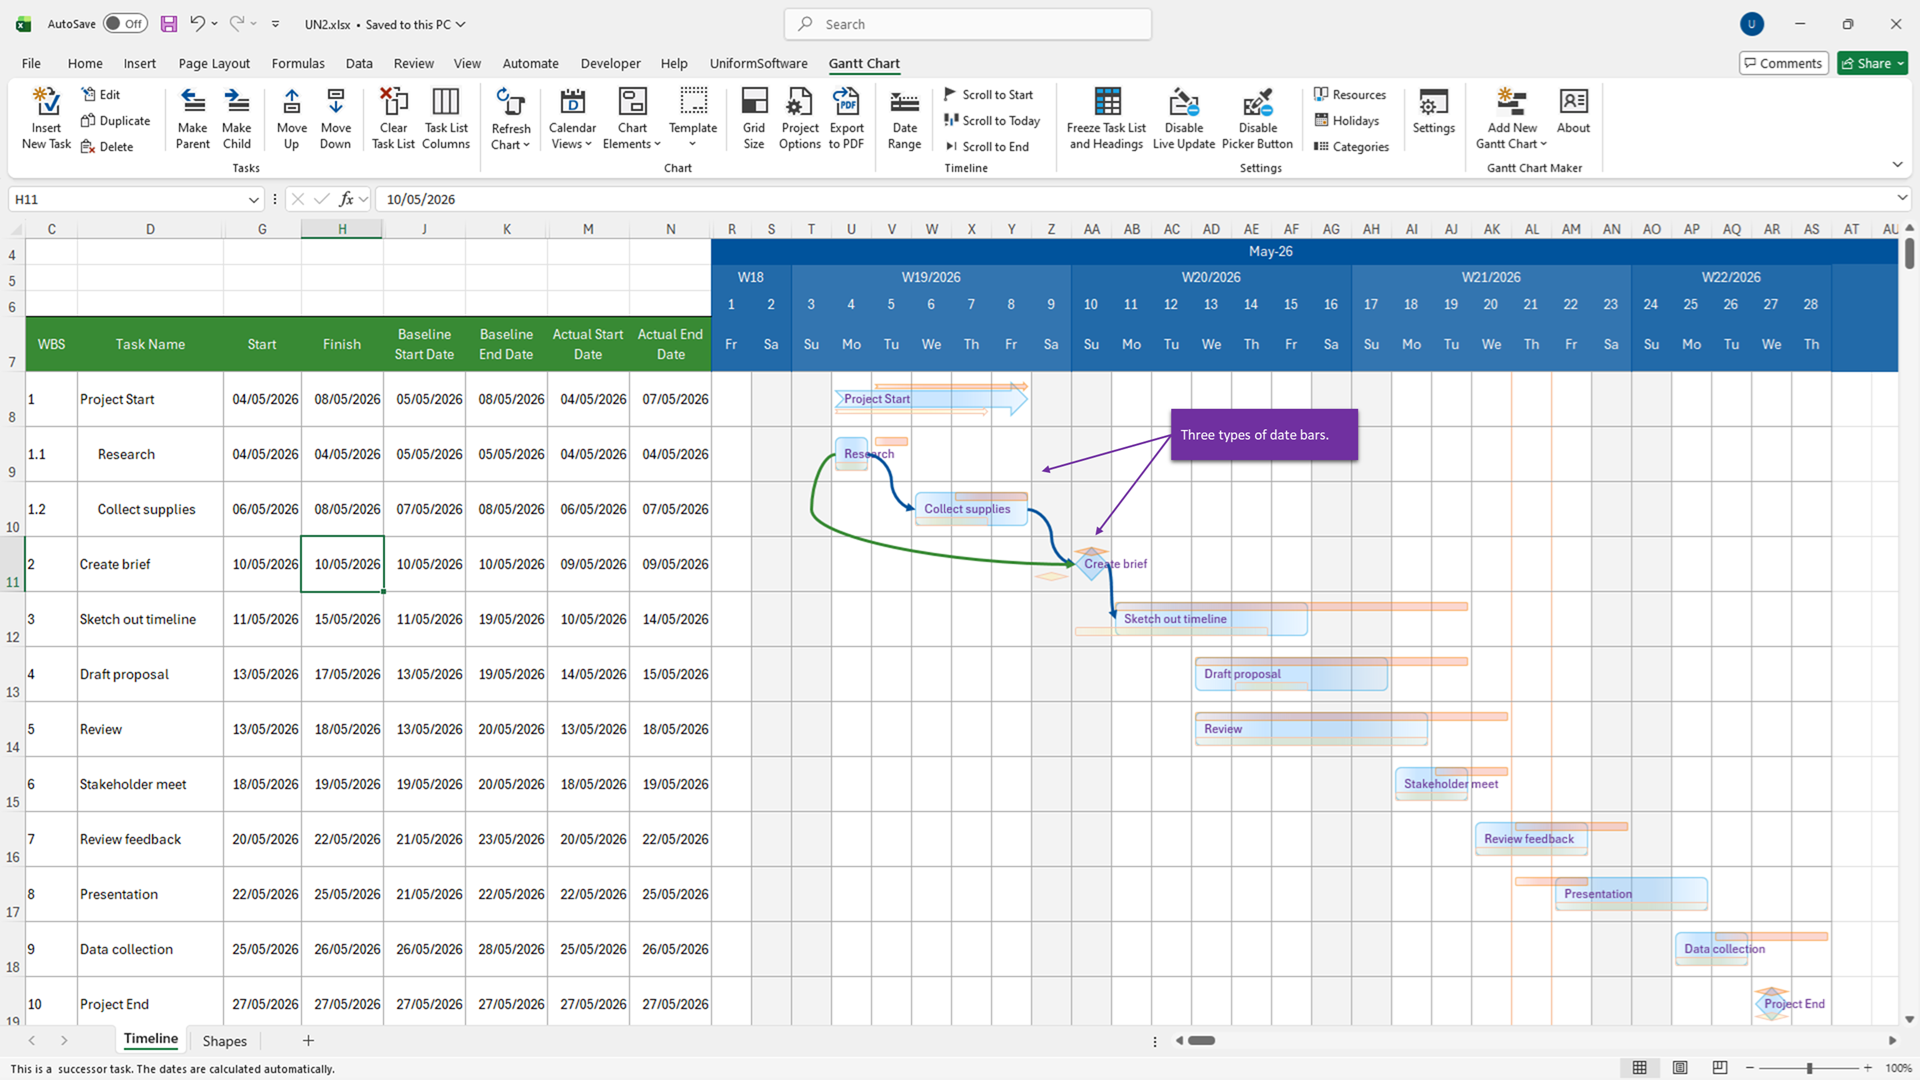
Track Project Variances with Baseline vs. Actual Analytics
Visualizing project progress means understanding the gap between your original planning baseline and actual field execution.
Our chart layout engine supports nested progress visualization bars. Toggle multi-layer visual bars on your ribbon to pinpoint delays, evaluate completion rates, and benchmark team speed instantly against initial project assumptions.
- Estimated BarsView your current planned target tracking dates layout.
- Baseline BarsLock and preserve your original schedule to monitor scope creep.
- Actual ProgressLayer actual execution milestones and shading directly on top.
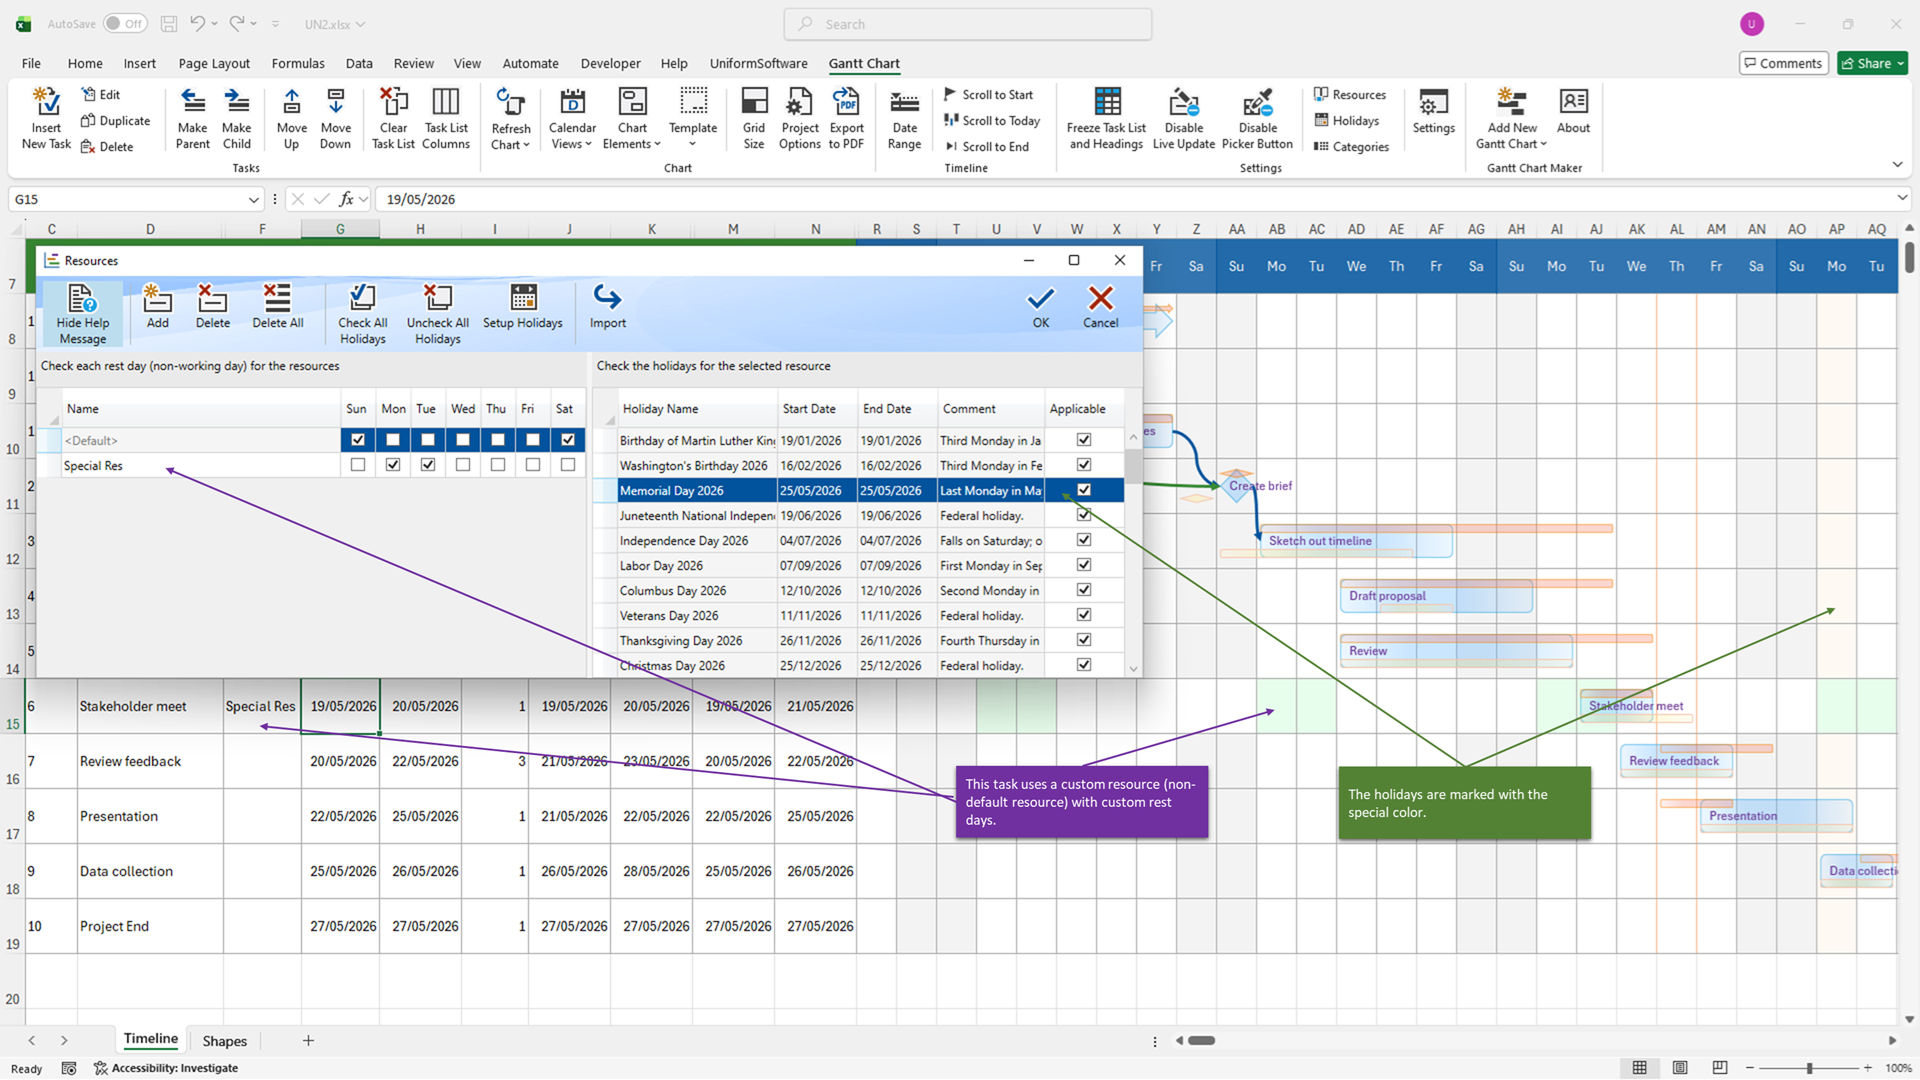
Intelligent Resource Management & Holiday Exclusion Calendars
Do not let weekends, institutional non-working days, or global holidays distort your target project completion math.
Gantt Chart Maker incorporates a smart calendar calculation layer. You can map out separate schedules, specify weekends, and import holiday lists directly into your project file configuration. The app dynamically handles the math behind duration ranges, jumping right over non-working zones so your target milestone deadlines remain accurate.
- Custom Rest Day MappingAdjust week rules and weekend configurations by region.
- External Holiday ImportsSafe import tools parse your regional corporate calendars.
- Resource Allocation PickerAssign distinct owners to target row tasks cleanly via custom UI panels.
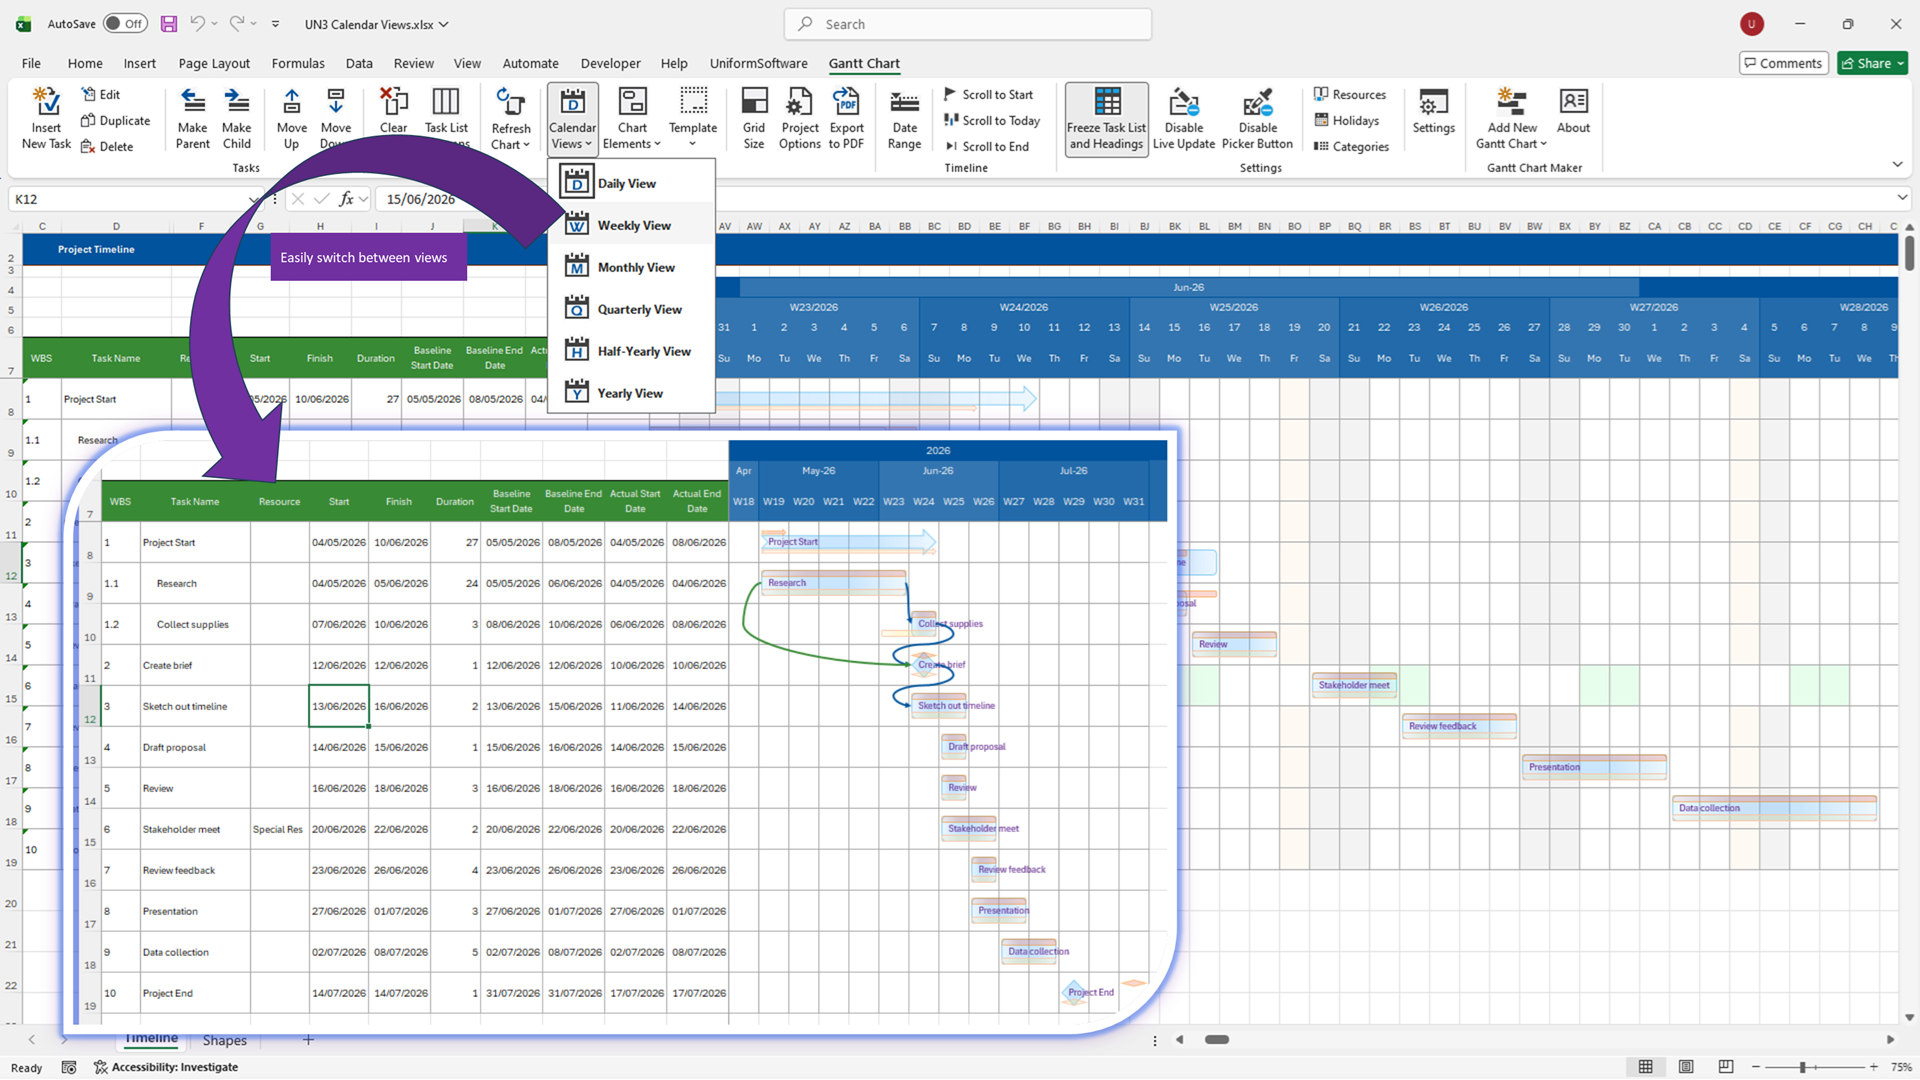
Flexible Timeline Views & 100% Customizable Sheet Layout Templates
Scale your layout context fluidly from granular development execution details to broad stakeholder presentations.
With a single click on the Excel ribbon menu, recalculate and re-render your entire visual structure across six scale variations: **Daily, Weekly, Monthly, Quarterly, Half-Yearly, or Yearly** timelines. Full support for international ISO week numbering parameters ensures uniform alignment across cross-border divisions.
Because our formatting templates are native Excel workbooks, you are never locked into predefined layouts. Modify theme color keys, adjust font configurations, and append tracking properties using standard Excel formatting skills.
Integrated Pro Workflow Enhancements
Designed to remove operational bottlenecks, accelerate data entry, and streamline executive reporting.
Multi-Month Date Picker
Double-click formatting fields to overlay a multi-month calendar dialog. Accelerate target entry while eliminating manual cell text input errors.
High-Fidelity PDF Export Utility
Package task columns alongside high-density vector diagrams safely into clean, presentation-ready PDFs configured perfectly for print or executive emails.
Frequently Asked Questions (FAQ)
Download and Subscribe
How do I choose?
- Choose Microsoft Store if you use a Microsoft account—usually for personal usage.
- Choose Microsoft Marketplace if you use a work or school account—usually for business and enterprise usage.
Learn More about Gantt Chart Maker & Timeline Project Planner for Excel
