What is Mind Map Maker for Excel?
Mind Map Maker is an intuitive excel mind mapping add-in and organization chart creator that runs natively within Microsoft Excel. It helps professionals visually develop, brainstorm, and organize complex ideas and hierarchical data without manually drawing shapes.
See it in action:
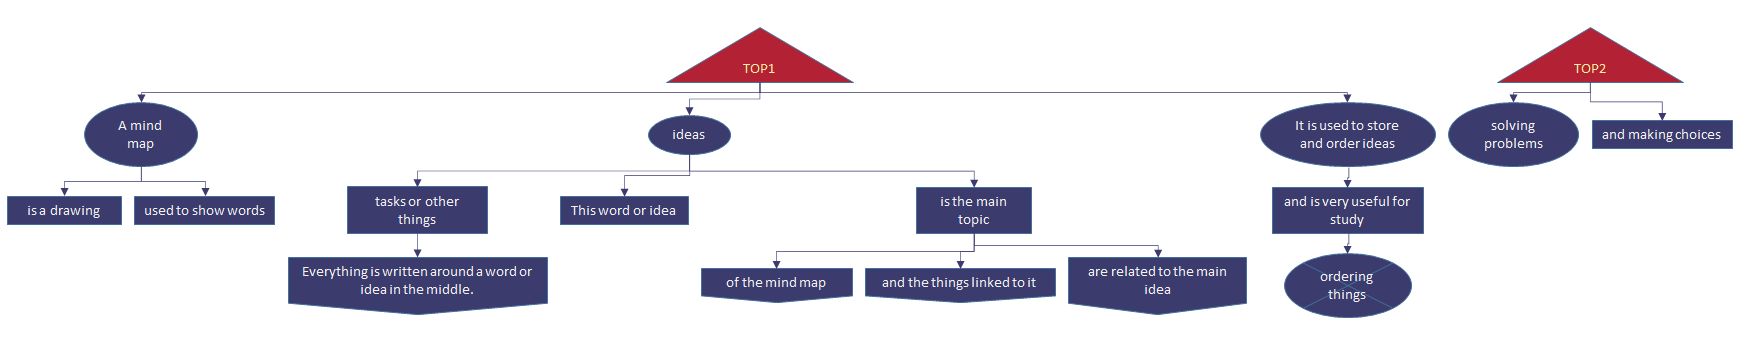
- See a sample output - The Getting Started document for Mind Map Maker, built with Mind Map Maker itself.
- Or the Excel version.
As a powerful automatic mind map generator for Excel, this plugin works in a completely different way compared to web whiteboard boards. You simply write down a structured node list in plain text—as if sketching it out on paper—and then click a button to instantly convert your text list to a diagram in Excel!
Highlight #1: Automatic Layout Engine
Stop wasting time manually aligning boxes. This specialized hierarchical chart maker for Excel handles the geometry for you. You can quickly use ribbon menu adjustments to split the chart layout, arrange parent-child relationships vertically or horizontally, display nodes at selective layout depths, and assign native WBS numbers automatically.
Highlight #2: Customizable Excel Mind Map Templates
The layout configurations and design choices are dictated directly by underlying stylesheets. Adjusting these customizable excel mind map templates empowers you to transform color schemes, node formats, and borders instantly, making it simple to map ideas while maintaining your strict company brand style guidelines.
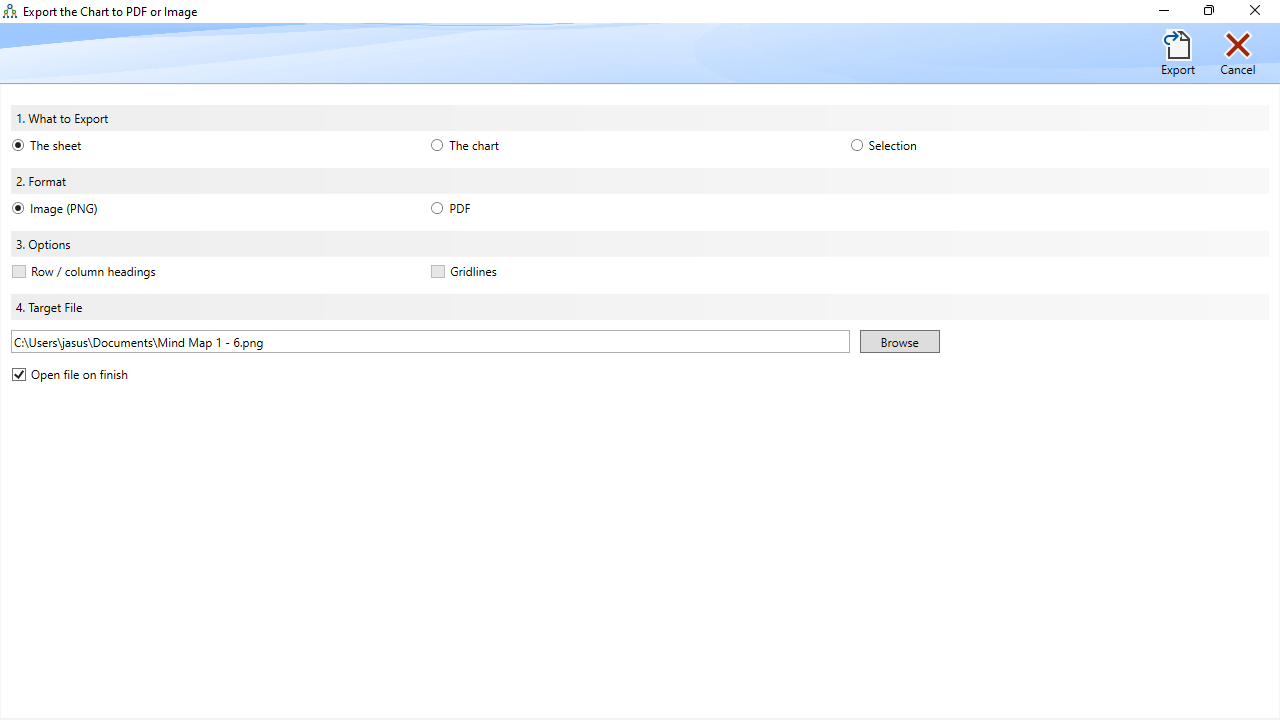
Highlight #3: Export Excel Mind Maps to PDF and Images
By coupling directly with PDF Creator for Excel, you can smoothly export your excel mind map to PDF or crisp presentation-ready image styles. Exporting options include translating the full dashboard matrix (the graphical chart alongside the raw node breakdown), isolation of the main structural flowchart, or targeted selections.
How to Create Mind Maps with the Excel Mind Mapping Tool
The quick start movie shows the detailed steps. Here is how easily you can create a mind map in Excel using our custom ribbon utility:
Step #1
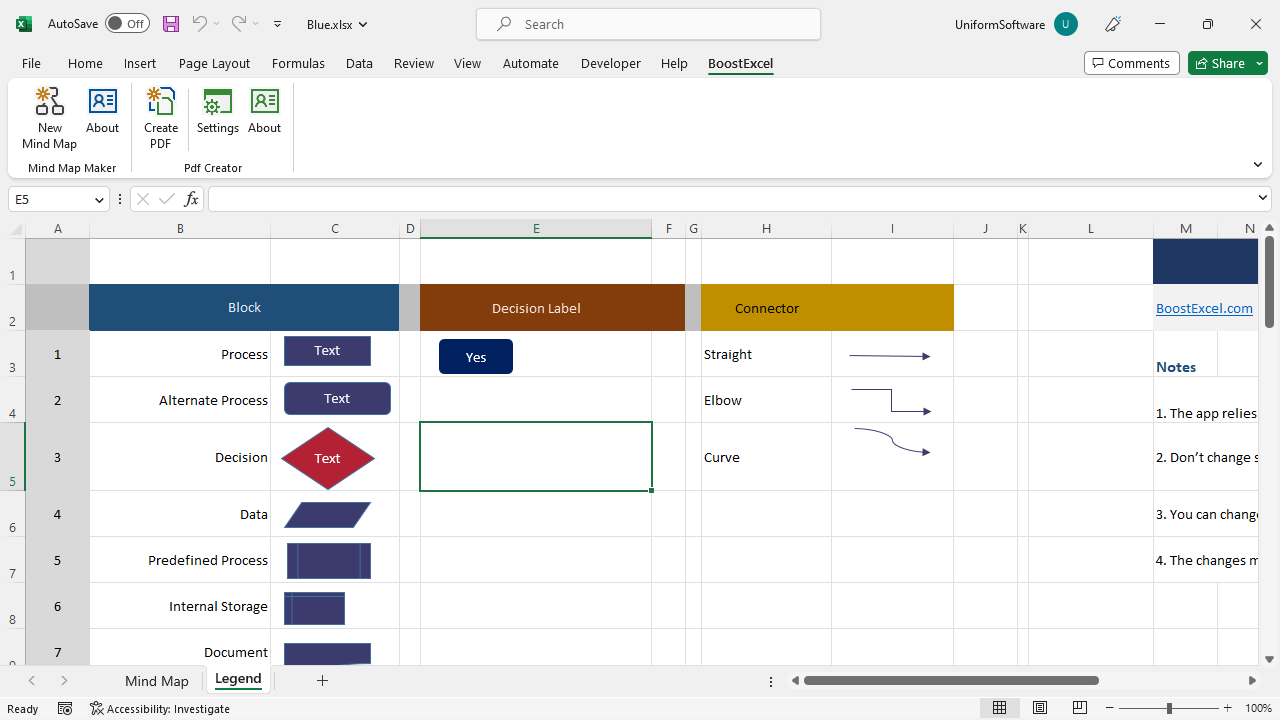
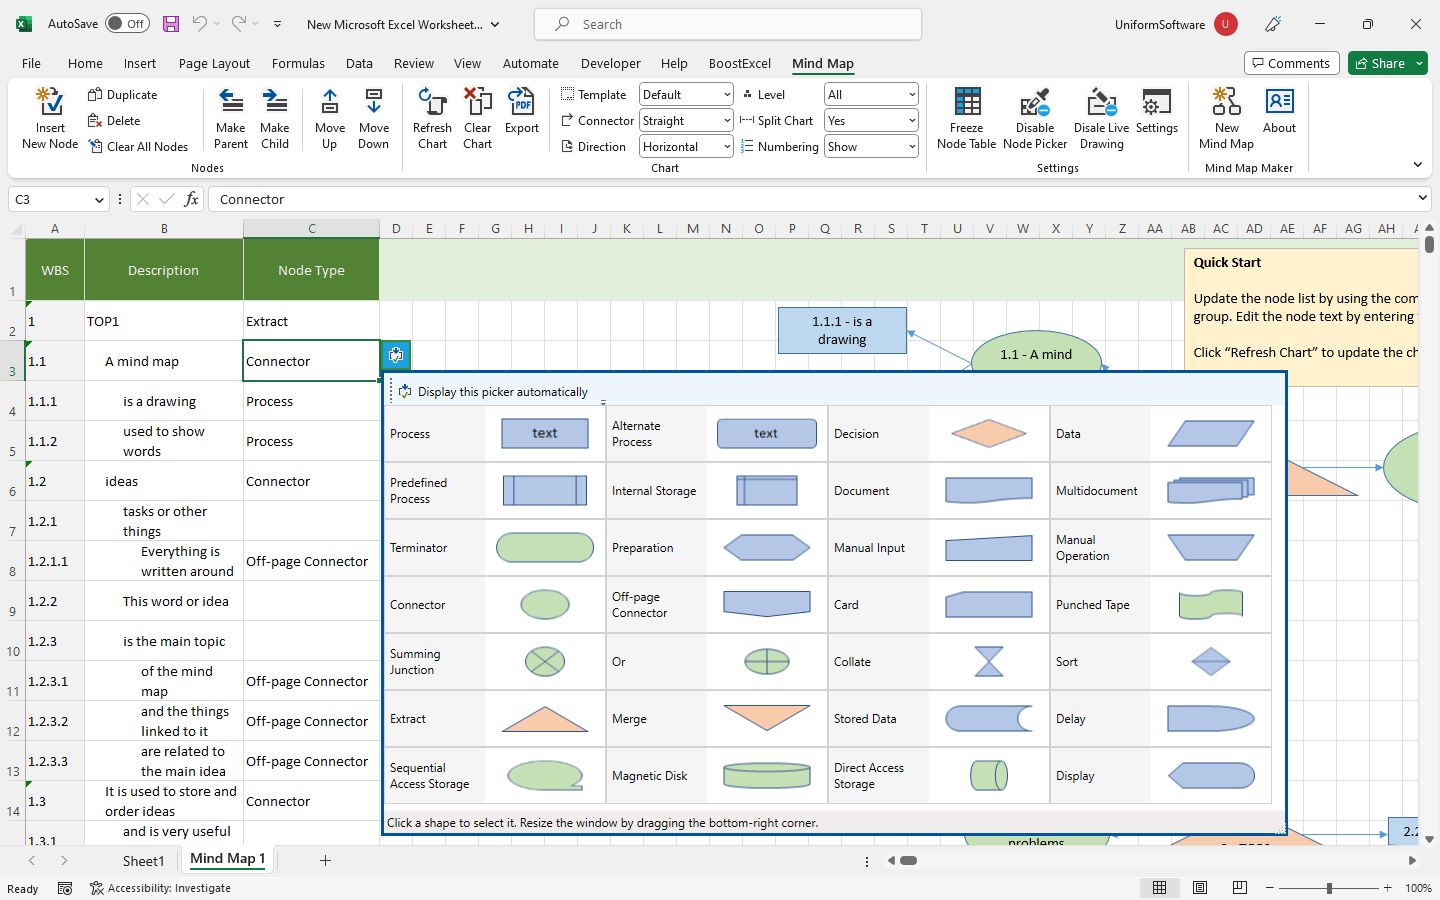
Start Excel. Navigate to the UniformSoftware (or BoostExcel) ribbon tab. Click on New Mind Map. This generates a new mind map sheet by importing a sample node list from the default template.
Step #2
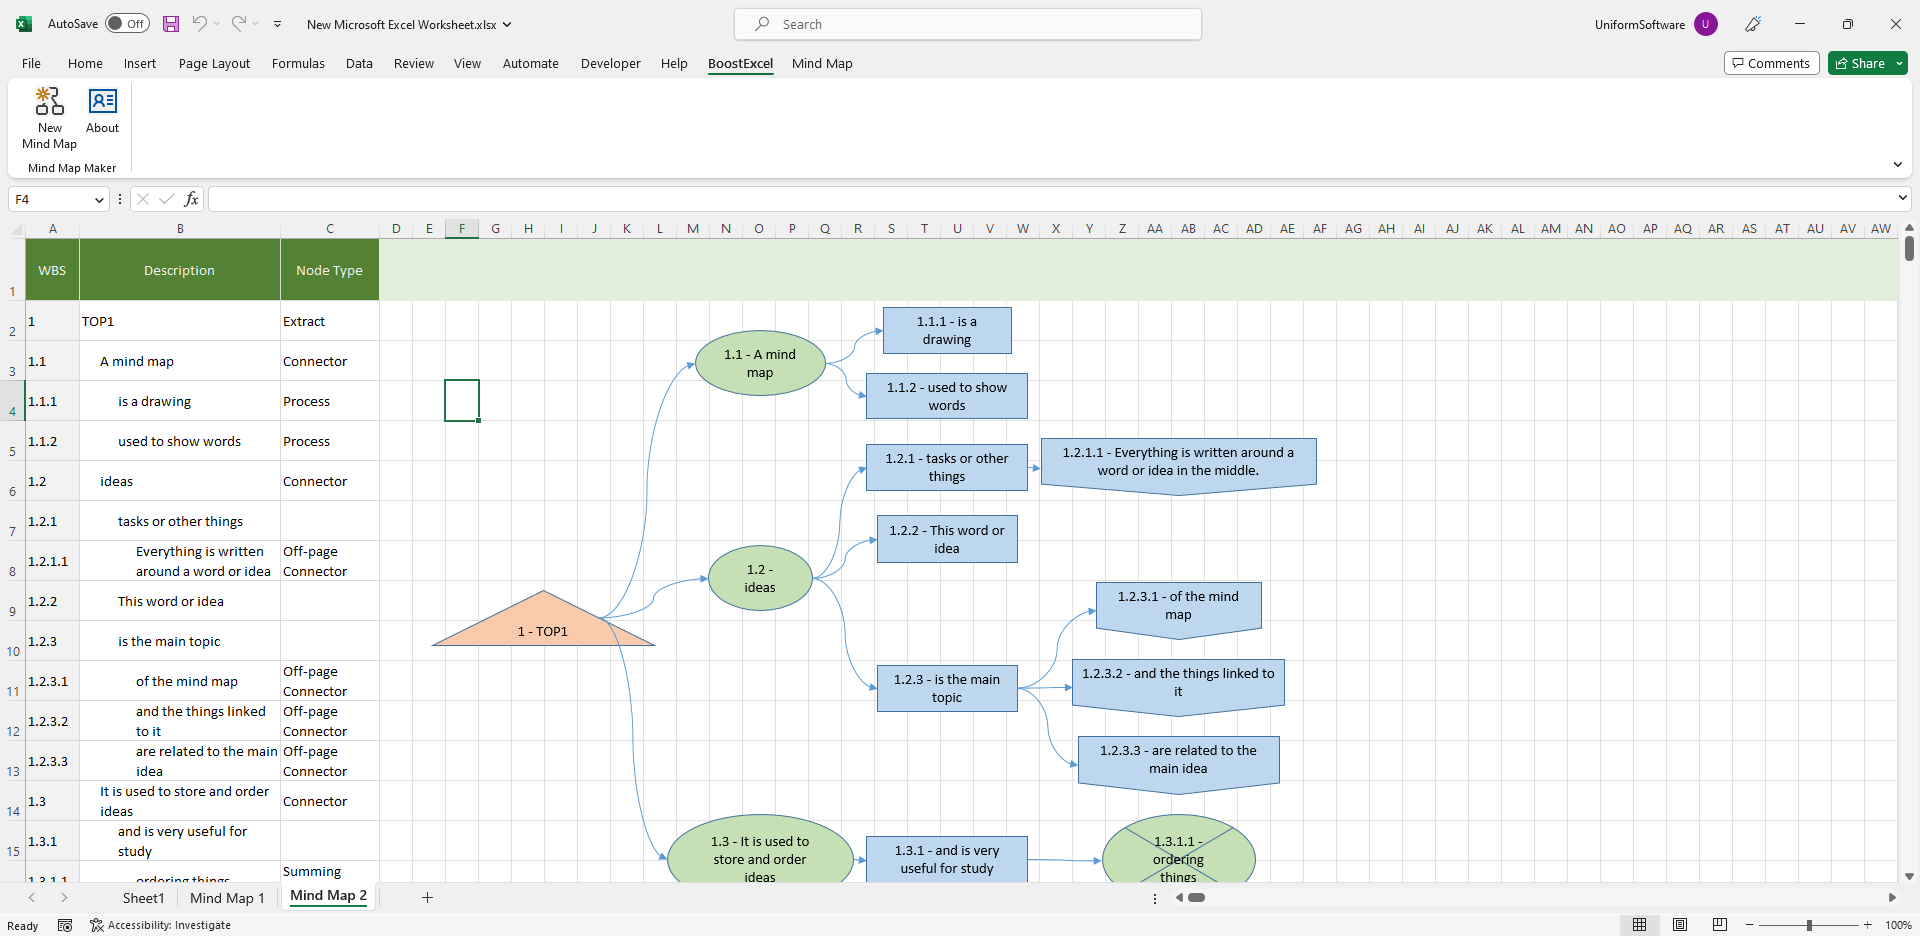
The structured node list is dynamically managed using standard WBS numbers. The Mind Map ribbon tab includes useful workflow buttons like Clear, Make Parent, Make Child, Move Up, and Move Down. You can also select the shape type of each node from an intuitive picker.
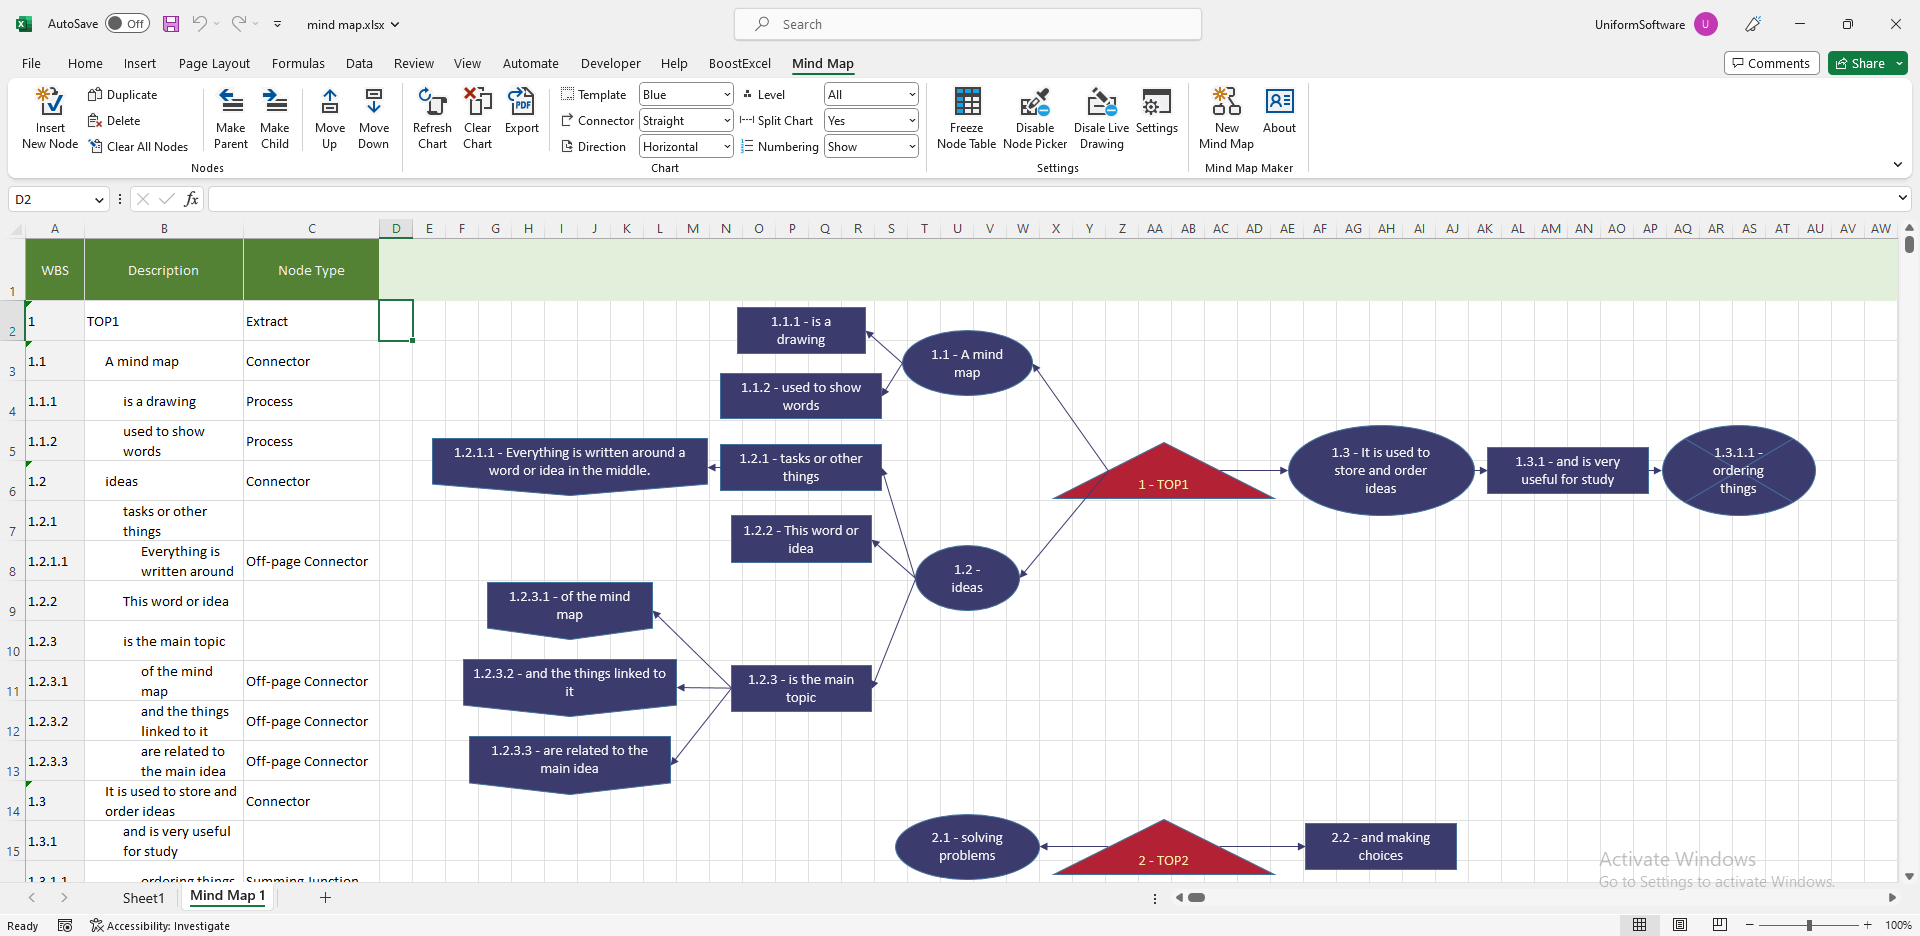
Step #3
Click Refresh Chart. The visual canvas updates on its own. Typically, you do not need to alter configurations manually by dragging and dropping. However, you always retain the complete freedom to manually refine layouts as needed.
Excel SmartArt Alternatives: Creating Mind Maps with Built-in Tools
We all know that Excel is built excellently for numerical tracking or structuring database grids across standard rows and columns. While it does package native visual engines for metrics, business analysts frequently seek a better way to create diagrams in Excel to document non-linear logic pathways without running external applications. If you do not possess a dedicated mind map excel plugin, there remain two classic manual approaches bundled natively inside standard spreadsheets: Basic Shapes and SmartArt Graphics.
Method 1: Manual Concept Maps Using Basic Excel Shapes
Shape objects in Microsoft 365 are fundamental graphic layers utilized to customize basic reports, slides, and vectors. When trying to solve how to map ideas in excel without drawing engines automatically, constructing hierarchies via raw vectors remains a painstaking, completely manual task—though achievable for micro-projects.
- Create and open a new Excel file.
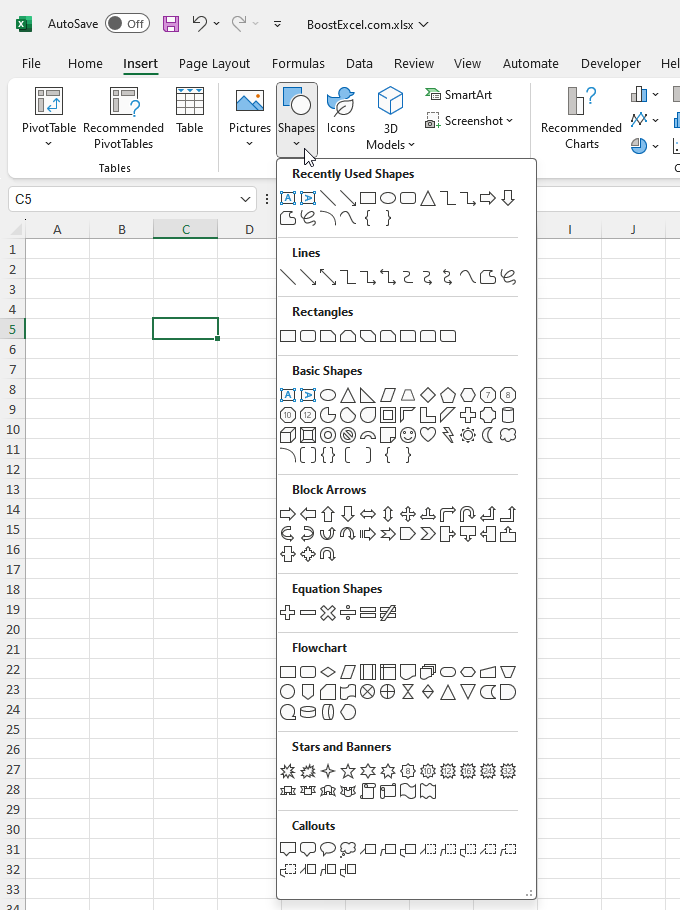
- Go to Excel's Insert ribbon tab.
- Click Shapes in the Illustrations ribbon group.

- Click a shape on the menu, and then click an empty area on the sheet. This creates a new shape.
- Repeat the above step to add additional shape objects.
- If you like, you can copy the existing shapes too. To do this, click to select the shape that you want to copy, then press CTRL+C on your keyboard, then press CTRL+V. This creates a new shape with the same size and color as the original one.
You can also use Excel's alignment tools against the mind maps and organization charts created by Mind Map Maker for Excel. Mind Map Maker for Excel by default aligns shapes automatically, but it also allows you to customize the diagrams by dragging and dropping. In this case, the alignment tools are very useful.
- To add text to a shape, right-click a shape and then choose Edit Text.
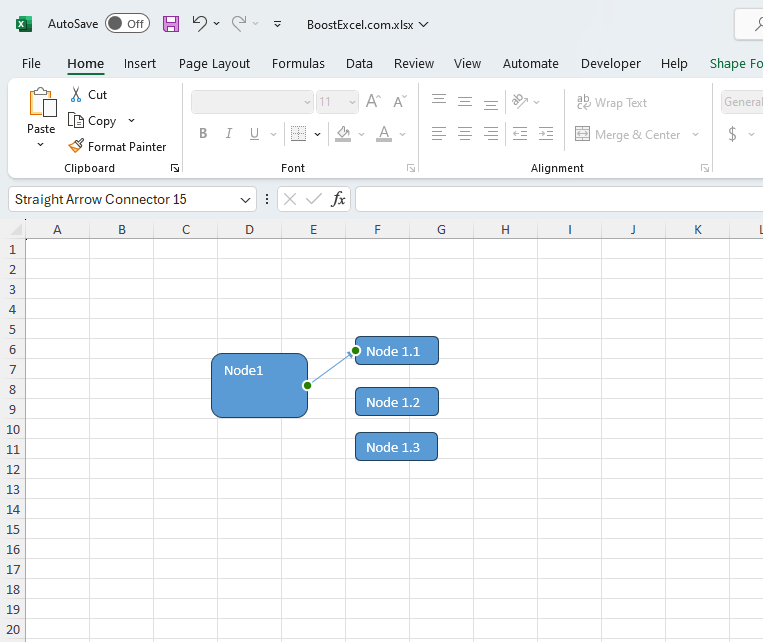
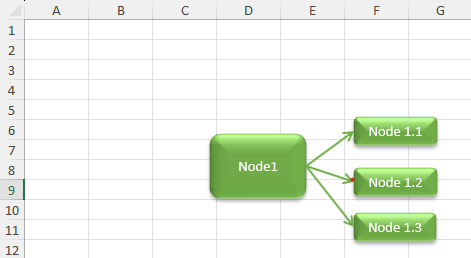
- To add a connect between two shapes, go to the Insert ribbon tab, pull down the Shapes list, and click one of the line objects in the Lines category. When you hover your mouse over a shape, it shows the available connection sites. Click on one of the connection sites; this makes the site the start point of the connection.
- Now drag the end of the connection line and place it on the site of the end node. This creates the relationship between the two nodes, as shown below.
- Excel offers many options for you to customize the effects of the shapes. Click and select a shape, and the Shape Format ribbon tab appears. Click and expand the Shape Styles list to choose a pre-defined shape style.
- This is the result of applying a shape style and setting a shape effect. Download it.
As you can see, Microsoft 365 provides numerous options for customizing shapes. You can change the shape's fill, outline, effects, size, alignment, rotation, and text. You can also use the Format Shape task pane to perform more advanced formatting. Mind Map Maker for Excel can use all of these features as well.
In fact, the mind map templates provided by Mind Map Maker for Excel are all based on the same template. We customize it to give it a unique appearance and feel. You can use these techniques too to create your own mind map template using the various tools provided by Excel.
Method 2: Standard Diagrams Using SmartArt Graphics
SmartArt Graphics provide structured layout blocks inside Office ecosystems to build rapid flowcharts. However, when treated as an excel smartart alternative for deep brainstorming, the engine exhibits significant friction—such as the total absence of editing configurations within Microsoft 365's cloud-based Web edition environment.
- Start Excel and create a new spreadsheet.
- Go to the Insert ribbon tab.
- In the Illustrations group, click SmartArt.
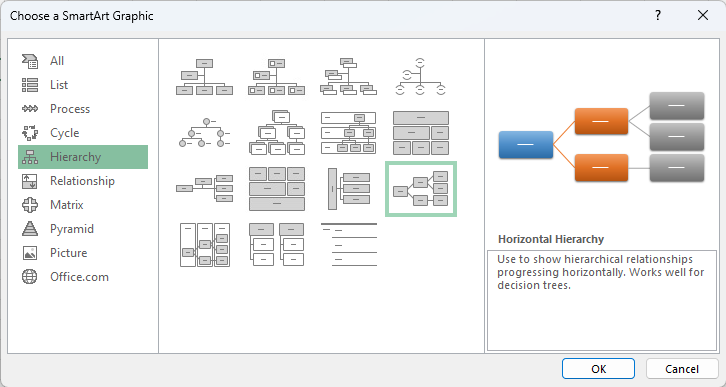
- There are nine types of graphics: lists, processes, cycles, hierarchies, relationships, matrices, pyramids, and pictures. We will select the Hierarchy category because a mind map is a diagram used to visually organize information into a hierarchy, demonstrating relationships between components of the whole.
Creating useful mind maps entails drawing a diagram that branches out from a central idea or concept, with related ideas and information linked to the central idea via lines and nodes. Mind mapping is a popular brainstorming technique because it allows for the visualization of relationships between ideas and aids in the generation of innovative ideas.
In contrast, flow chart analysis is a tool for analyzing and mapping a process or decision-making flow. Decision trees are diagrams that depict various decision options and potential outcomes, whereas flow chart analysis is a visual representation of a process that shows each step and decision point. Mind mapping works best for brainstorming and organizing ideas, while decision trees and flow chart analysis are used to analyze and optimize processes and decision-making flows.
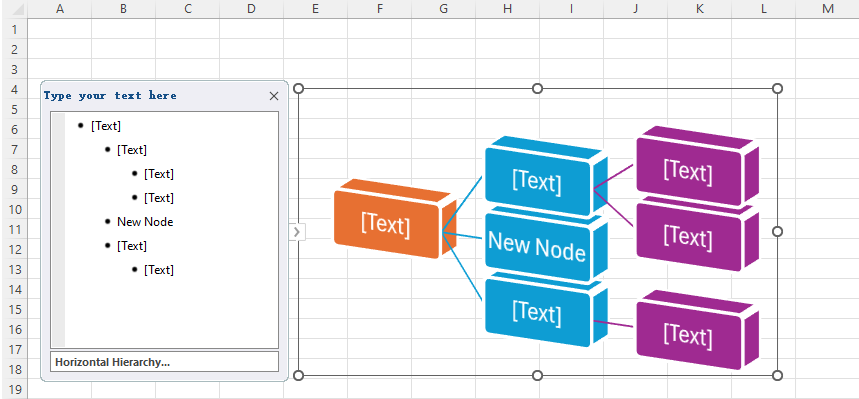
- Choose the horizontal hierarchy. This is used to show hierarchical relationships progressing horizontally. This layout is also the default and basic layout implemented by Mind Map Maker for Excel.
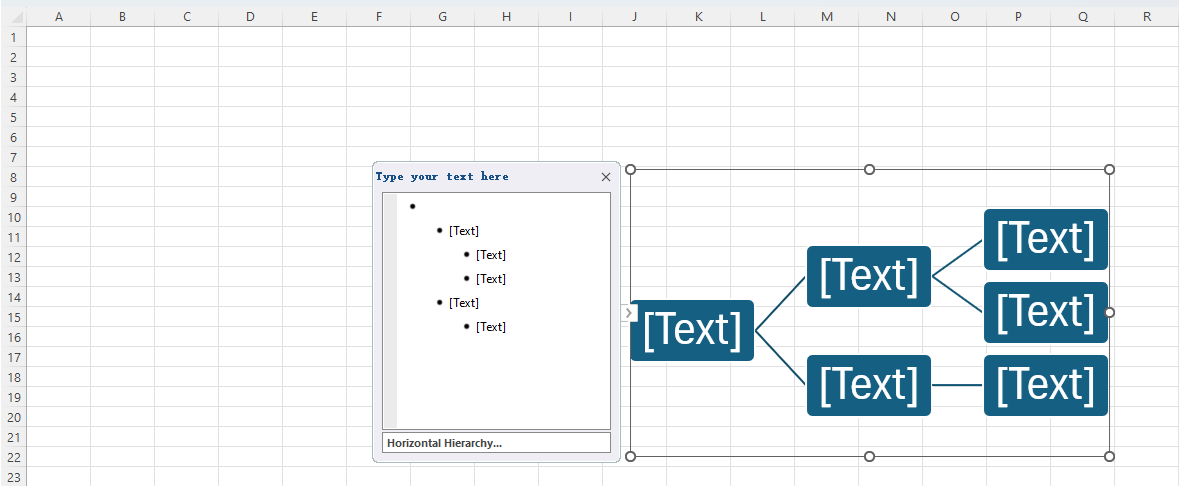
- Click OK to insert the graphic into the sheet. The "Type your text here" pane allows you to enter descriptive text for each node.
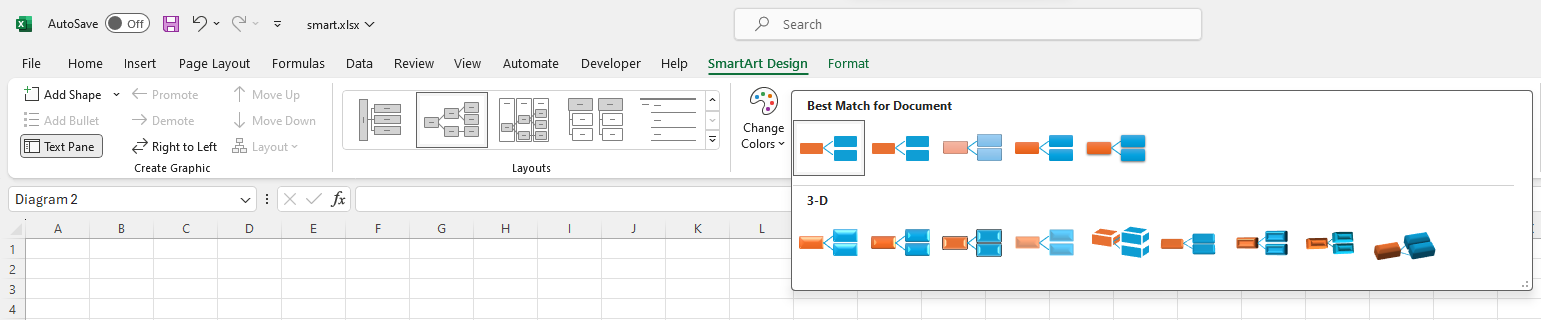
- Click and activate the SmartArt Design ribbon tab.
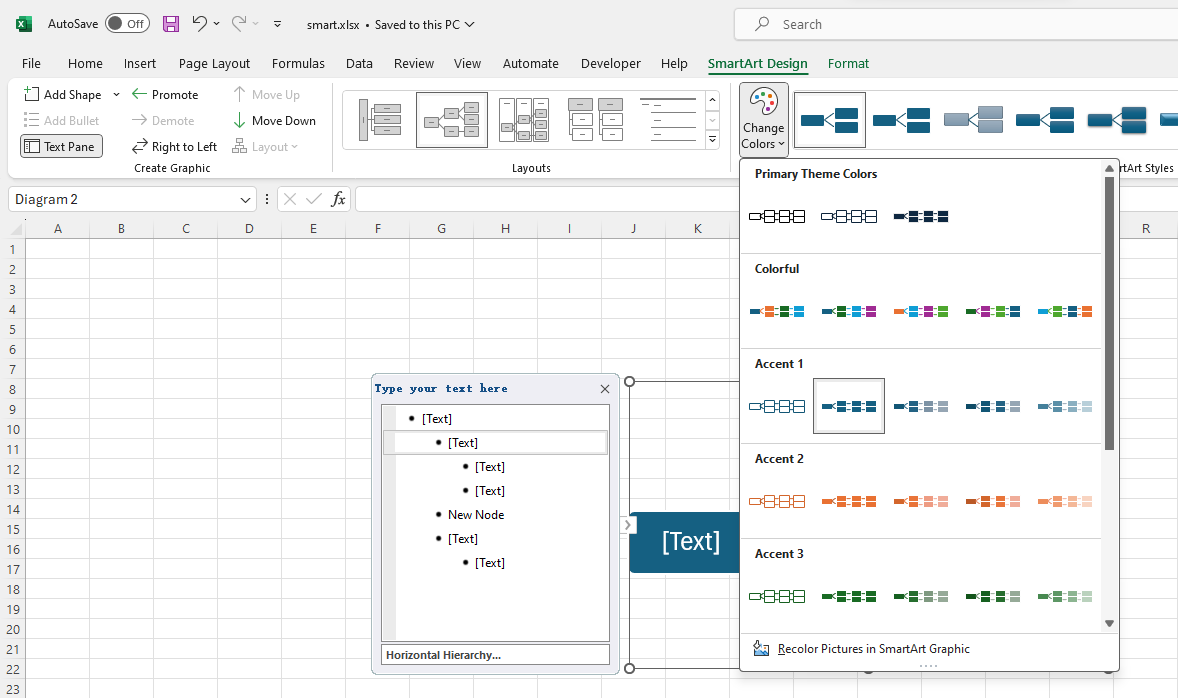
- Select the top node in the second level of the new SmartArt graphic, and then pull down the Add Shape menu in the Create Graphic command group.
- There are five commands here.
- Add Shape After, Add Shape Before: These two commands add a new node as a sibling of the selected node.
- Add Shape Above, Add Shape Below: These two commands add a new node that is one level above or below the selected node.
- Add Assistant: Adds an assistant to your organization chart. This option is only available if you have chosen an organization chart layout, found in the hierarchy category.
In Mind Map Maker for Excel, nodes are organized using a WBS numbering system, which is an easy way to organize data in a hierarchical style.
By using the WBS numbering system, you can easily add new nodes and change the parent-child relationships between the nodes.
- Click and expand the Change Colors menu. The predefined color groups allow you to easily change the color schema of the diagram.
In Mind Map Maker for Excel, colors and styles are based on editable mind map templates. The templates are Excel files too. Our application provides several predefined templates; you can also create your own by copying our file and then updating it. This enables you to easily apply your brand style to your diagrams.
- Expand the SmartArt Styles list. It shows several predefined styles for the current chart. Click to choose the one you like.
- This is the result we built in this tutorial. Download it.
To further customize a SmartArt-based diagram, you can even convert it to basic shapes. This enables you to customize each shape separately. To do this, follow the steps below.
- Click to select the SmartArt graphic.
- Go to the SmartArt Design ribbon tab.
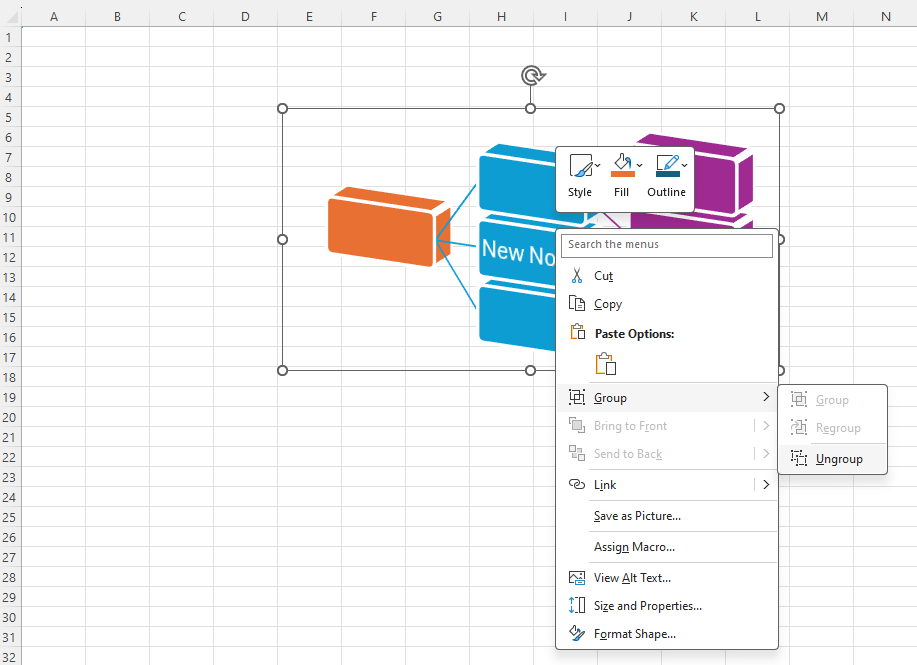
- Click Convert to Shapes in the Reset group. This converts the SmartArt graphic to a shape group.
- Right-click on the group, choose Group, and then Ungroup.
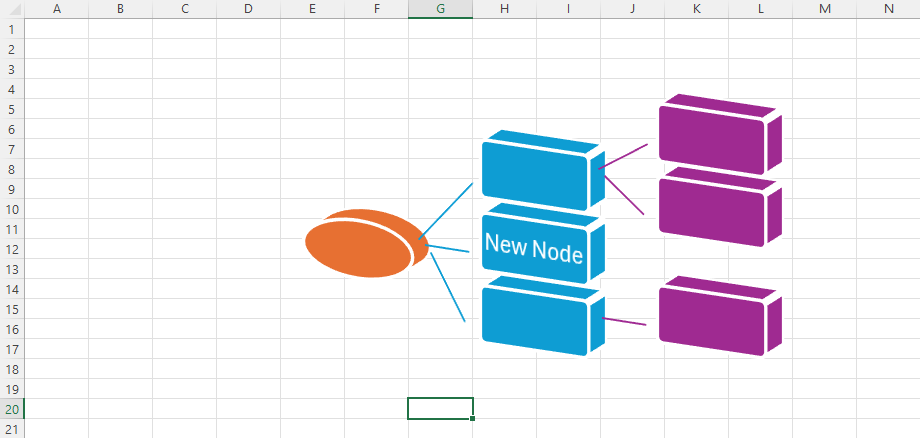
- Now you can customize each shape in the graphic separately. For example, here, the root node is changed from a rectangle to a circle. Download It.
Mind Map vs SmartArt Excel: Detailed Feature Comparison
To assist you in evaluating the absolute best way to create diagrams in Excel, let's look at a head-to-head comparison table mapping out manual shapes, standard SmartArt modules, and our custom automation plugin:
| Basic Shapes | SmartArt Graphics | Mind Map for Excel | |
|---|---|---|---|
| Price | Free | Free | Not free. One-month fully functional trial period. After the trial period, you must subscribe to keep it. |
| How to create a diagram | Draw freely on a canvas (i.e., the sheet). | Insert a pre-defined template. | Write down a list of textural nodes. It is as easy as sketching a mind map out on papers. Mind Map Maker for Excel creates the diagram automatically from the list. |
| How to define relationships | Add arrow lines (connectors) to create parent-child relationships. | The relationship between nodes is defined by a template. | Use a WBS numbering system to define the relationships between nodes. |
| How to customize the diagram | Apply styles and effects individually to each shape or as a group of shapes. | Apply styles and effects to the whole diagram. If you want to customize a shape separately, convert the SmartArt graphic to basic shapes. | The styles and effects are applied based on templates. You can also apply special styles and effects to individual shapes, like using basic shapes. |
| How to align shapes | Use the "Align" commands on the ribbon. | Shapes are aligned automatically. | Shapes are aligned automatically. |
| Microsoft 365's Web edition | Yes | No. Excel for the Web does not support running or interacting with SmartArt. To use SmartArt, open this file with the desktop app. | No. Mind Map Maker for Excel is implemented using a COM add-in. Excel for the Web does not run the COM add-in. However, there will be no problem opening a diagram created by Mind Map Maker for Excel. |
In conclusion, Mind Map Maker for Excel falls somewhere between basic shapes and SmartArt Graphics. It makes creating mind maps faster and easier than using basic shapes, but not as quick and easy as using SmartArt graphics. On the other hand, SmartArt Graphics define relationships between nodes using various templates, so there is no easy way to change a relationship unless you convert a graphic to shapes. Mind Map Maker could be viewed as a compromise between basic shapes and SmartArt Graphics in terms of flexibility and ease of use. If you have Microsoft 365, go to the quick start video to learn how it works.
Because of its extensive functionality, we frequently use Microsoft Excel for a variety of organizational purposes. Although Excel is not specifically designed for this purpose, the basic shapes and SmartArt graphics are two different ways to create mind maps and organizational charts. Mind Map Maker for Excel aims to make mind mapping more user-friendly and flexible.
Download and Subscribe
How do I choose?
- Choose Microsoft Store if you use a Microsoft account—usually for personal usage.
- Choose Microsoft Marketplace if you use a work or school account—usually for business and enterprise usage.
| Microsoft Store | Microsoft Marketplace |
|---|---|
