Start with a Structured Data Table — No Drawing Required
Instead of manually dragging and dropping shapes, you describe your process as a plain text table. Flowchart Maker does all the drawing for you.
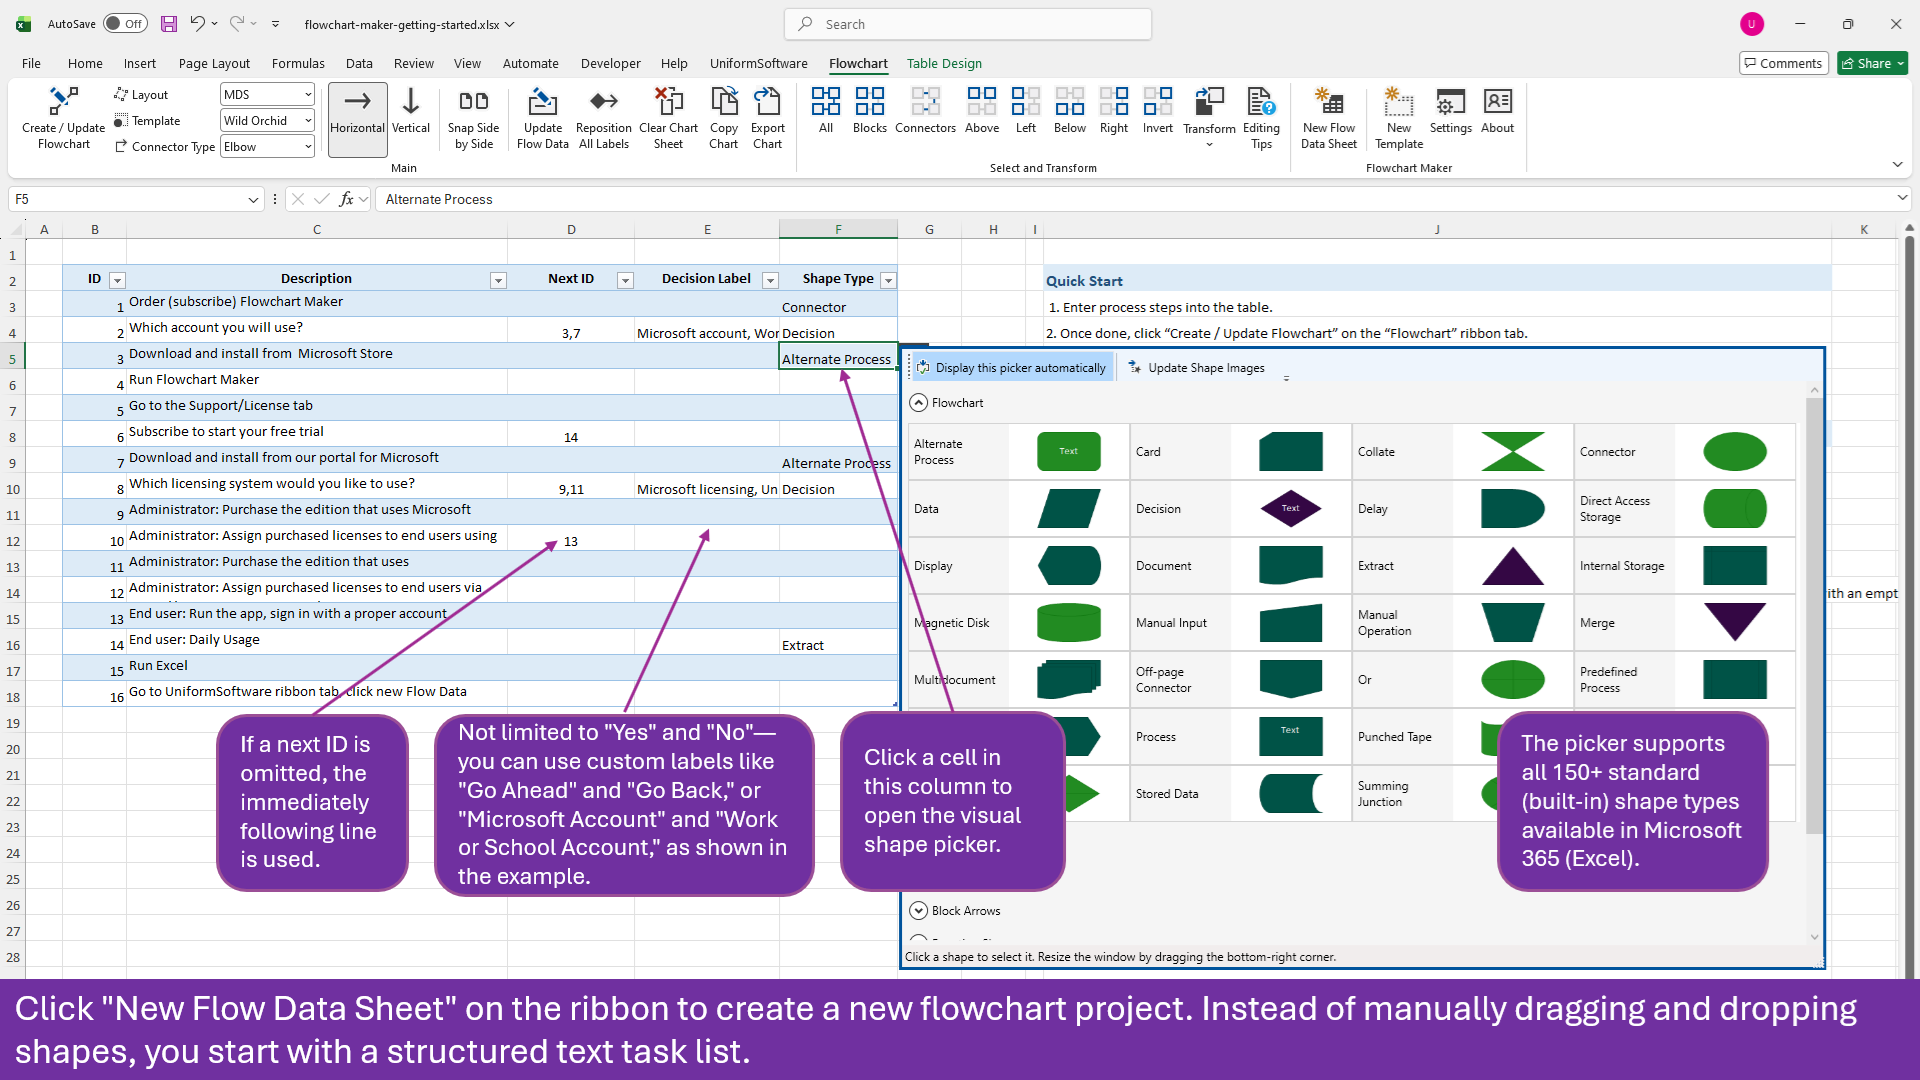
Click New Flow Data Sheet on the ribbon to generate a pre-formatted table. Each row is one step: enter an ID, the description that appears inside the shape, the ID of the next step, and a shape type. If you omit an ID, the row number is used automatically. If you omit a Next ID, the following row is linked by default.
- Visual Shape Picker — 150+ Shape TypesClick any cell in the Shape Type column to open a visual picker. It supports all 150+ standard shape types built into Microsoft 365 Excel — rectangles, diamonds, ovals, callouts, cylinders, and more.
- Custom Decision Branch LabelsNot limited to "Yes" and "No" — you can use any text as a branch label, such as "Go Ahead" / "Go Back" or "Microsoft Account" / "Work or School Account."
- Smart DefaultsEmpty Shape Type cells use the default shape automatically. Leaving the Description cell empty signals the end of the table.
One Click to Generate or Update Your Flowchart Instantly
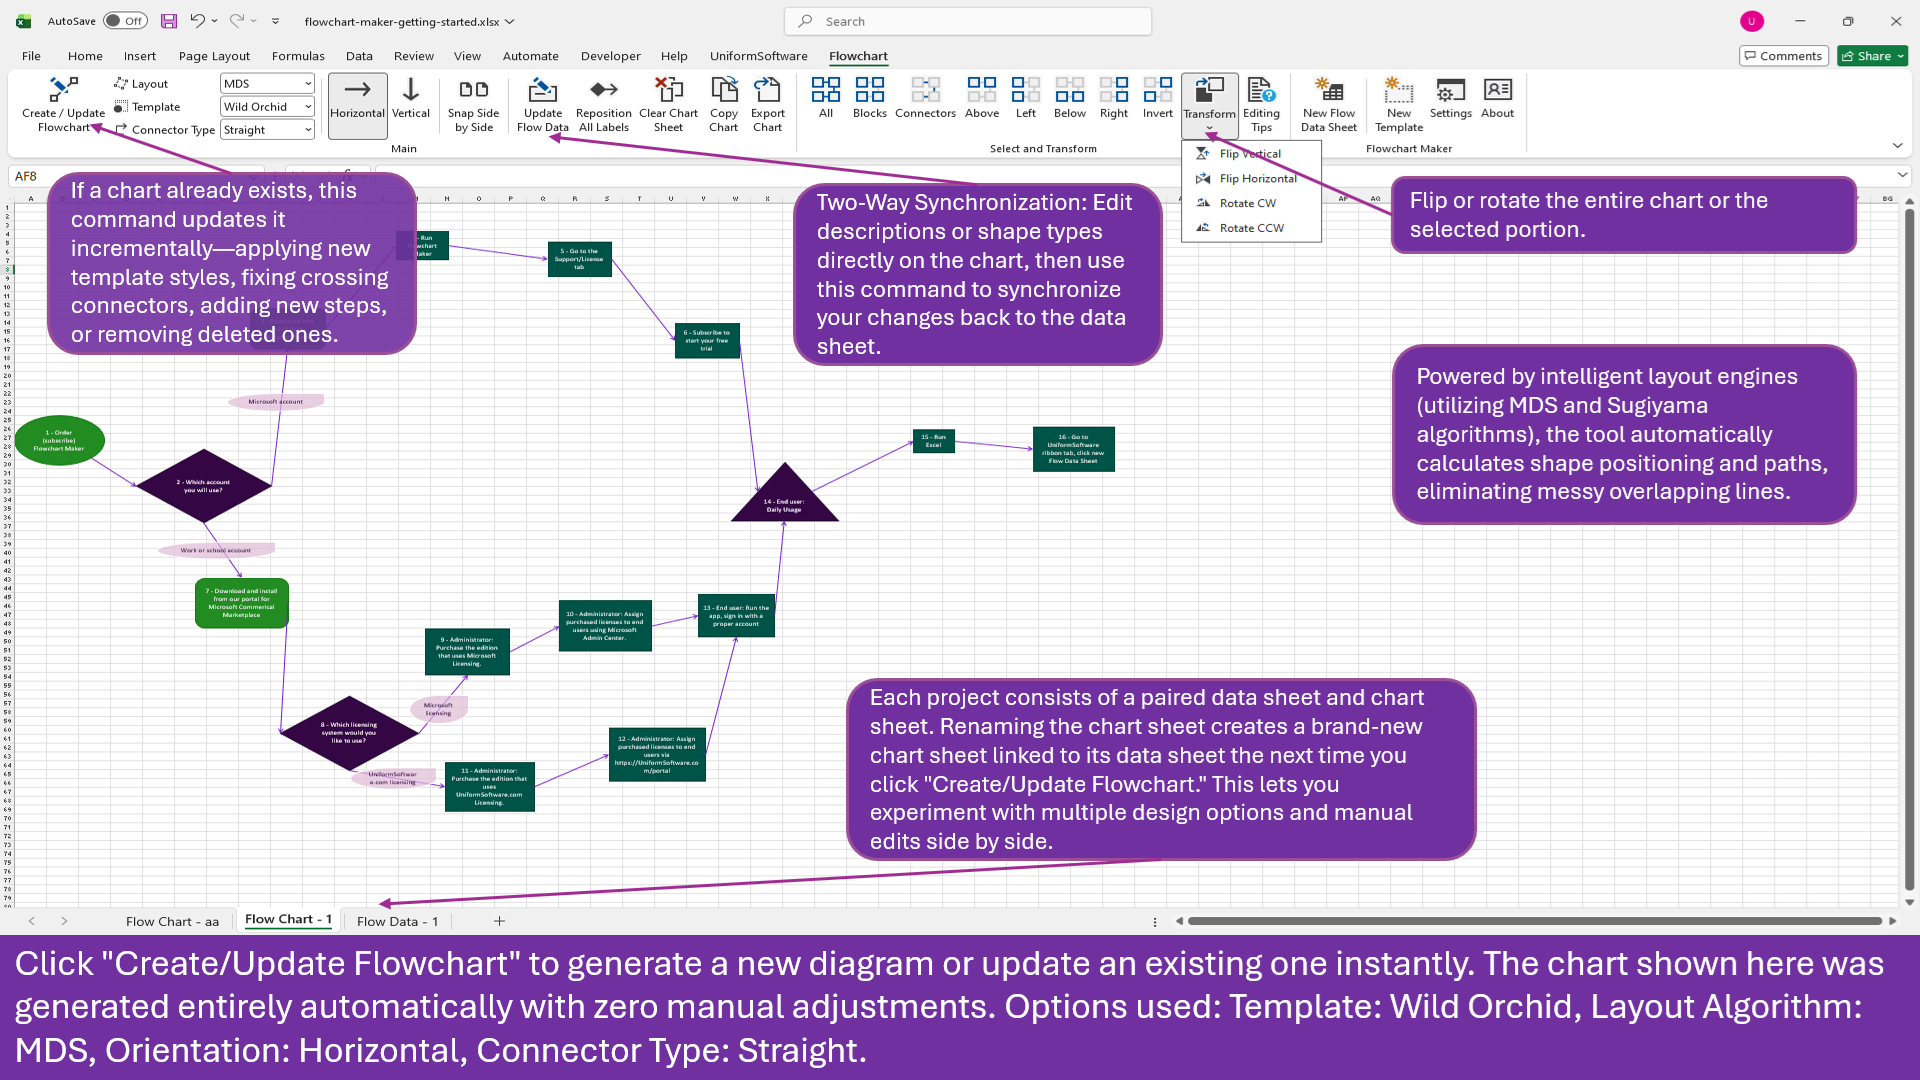
Click Create / Update Flowchart and the diagram appears on a dedicated chart sheet — shapes positioned, connectors routed, labels placed — with zero manual adjustments.
Powered by intelligent layout engines using MDS (Multidimensional Scaling) and Sugiyama algorithms, the tool automatically calculates shape positions and connector paths, eliminating messy overlapping lines. If a chart already exists, the same command updates it incrementally — applying new template styles, fixing crossing connectors, adding new steps, or removing deleted ones.
- MDS & Sugiyama Auto-LayoutChoose the algorithm that fits your flow — MDS for general-purpose and looping processes, Sugiyama for clean, layered hierarchies. Toggle Horizontal or Vertical orientation with one click.
- Paired Chart Sheet and Data SheetEach project links a data sheet to a chart sheet by name. Rename the chart sheet to create a brand-new chart — useful for exploring multiple design options side by side without losing your original.
- Two-Way SynchronizationEdit descriptions or shape types directly on the chart, then click Update Flow Data to synchronize your changes back to the data table — no re-entry needed.
Fully Editable — Built on Standard Microsoft 365 Shapes
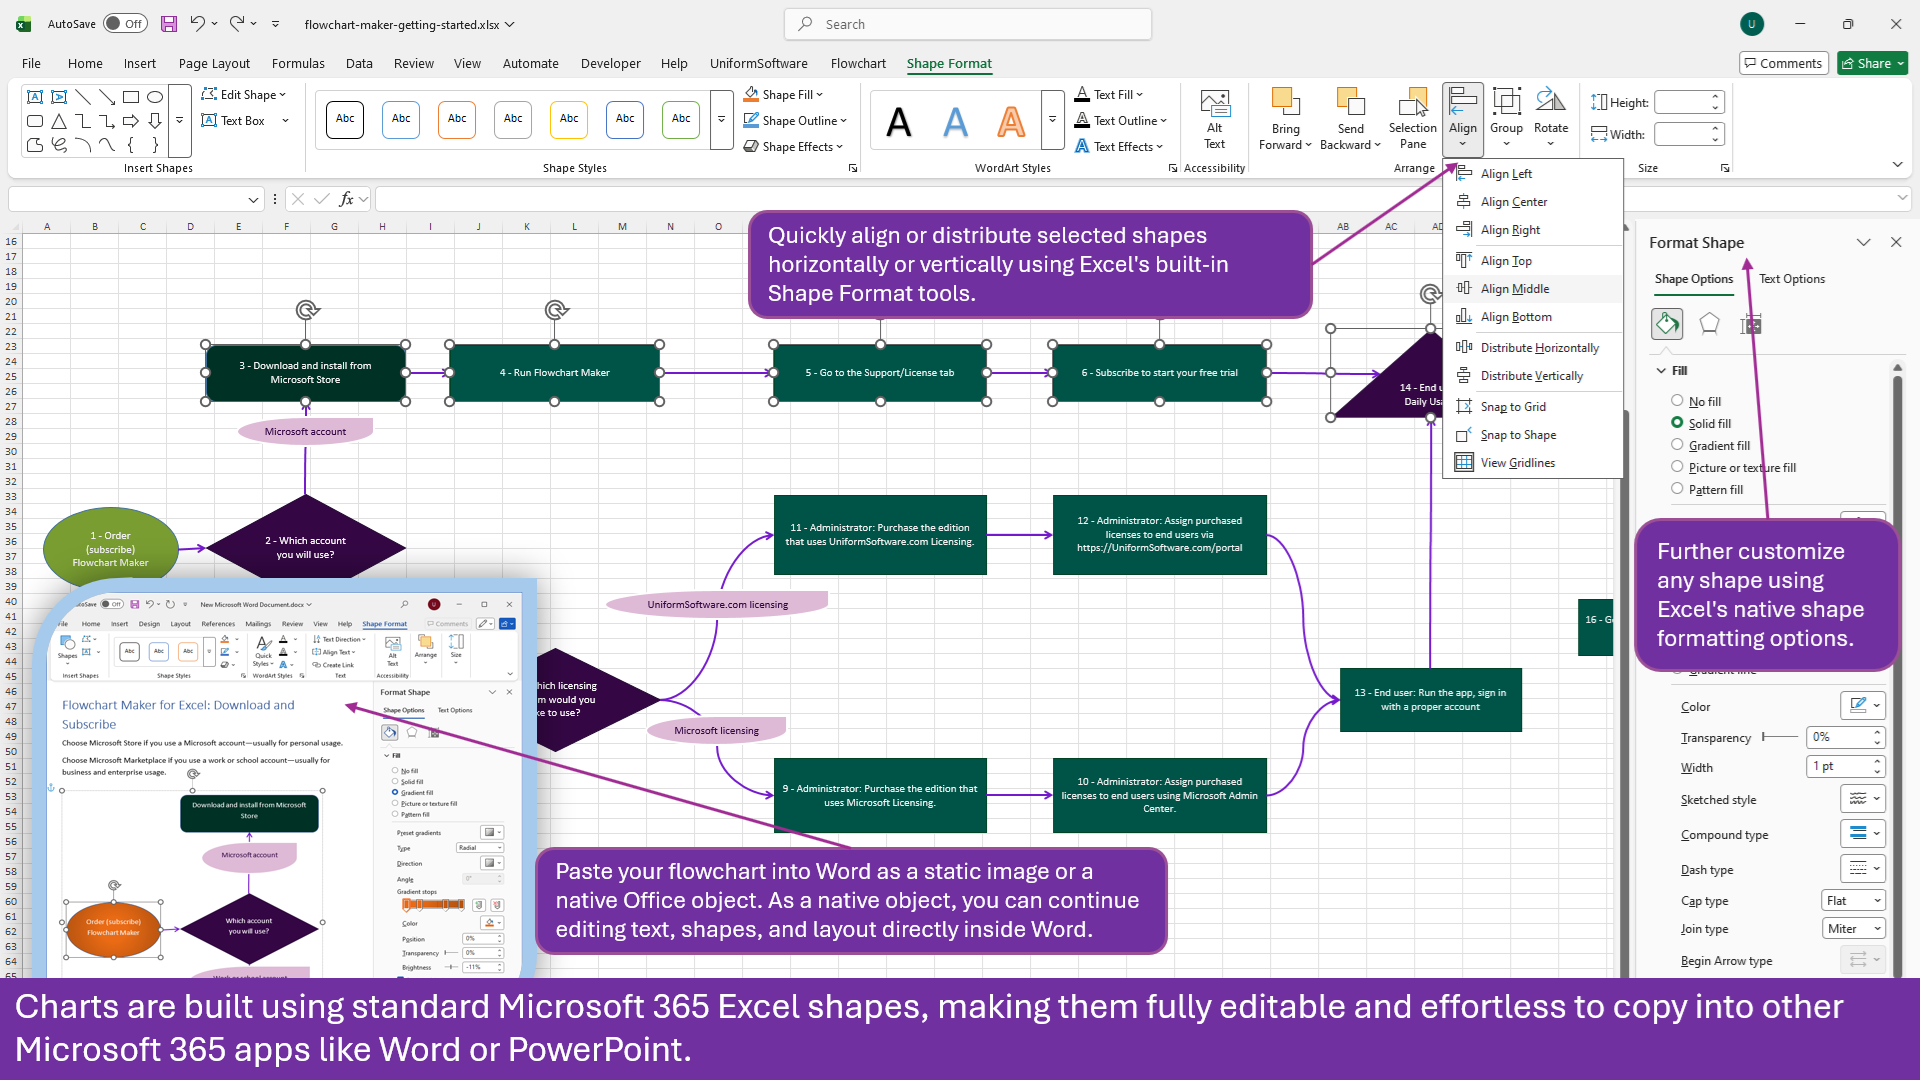
Every shape in your flowchart is a native Microsoft 365 Excel shape object — not an image, not a special format. You keep full editing power inside Excel and across the entire Office suite.
Use Excel's built-in Shape Format ribbon to align, distribute, resize, recolor, or add effects to individual shapes or groups. Use the Format Shape task pane for advanced options such as gradient fills, shadow effects, and text formatting. When you are ready to share, copy the chart and paste it into Word or PowerPoint as a native Office object — you can continue editing text, shapes, and layout directly in the destination app.
- Excel Shape Format ToolsAlign or distribute selected shapes horizontally or vertically using Excel's built-in Shape Format alignment commands — no third-party tools needed.
- Paste into Word or PowerPointPaste as a static image for simplicity, or as a native Office object to keep editing text, shapes, and connectors directly inside Word or PowerPoint.
- Copy Chart CommandUse the Copy Chart ribbon button to copy the entire flowchart to the clipboard as a grouped Office shape object, ready to paste into any Microsoft 365 app.
Snap Side by Side — Keep Your Data and Diagram in View at the Same Time
Snap your flowchart and data sheet side by side with a single click — perfect for ultra-wide displays or dual-monitor setups.
Click Snap Side by Side on the Flowchart ribbon and Excel tiles the data sheet and chart sheet into two windows next to each other automatically. Edit a step description in the data table and see where that step sits in the diagram — no switching tabs, no losing your place. On multiple monitors, simply drag the individual windows onto separate screens for even more workspace.
- One-Click Window TilingAutomatically arranges the data sheet and chart sheet windows side by side — no manual window resizing or dragging required.
- Dual-Monitor ReadyAfter snapping, drag each window onto a different monitor for a fully dedicated view of your data on one screen and your chart on the other.
- Zoom to Fit Any ScreenUse Excel's built-in Zoom tool to scale the chart sheet to the right magnification for your screen size — from compact laptops to ultra-wide monitors.

Multiple Templates — Apply a Theme or Create Your Own with Brand Colors
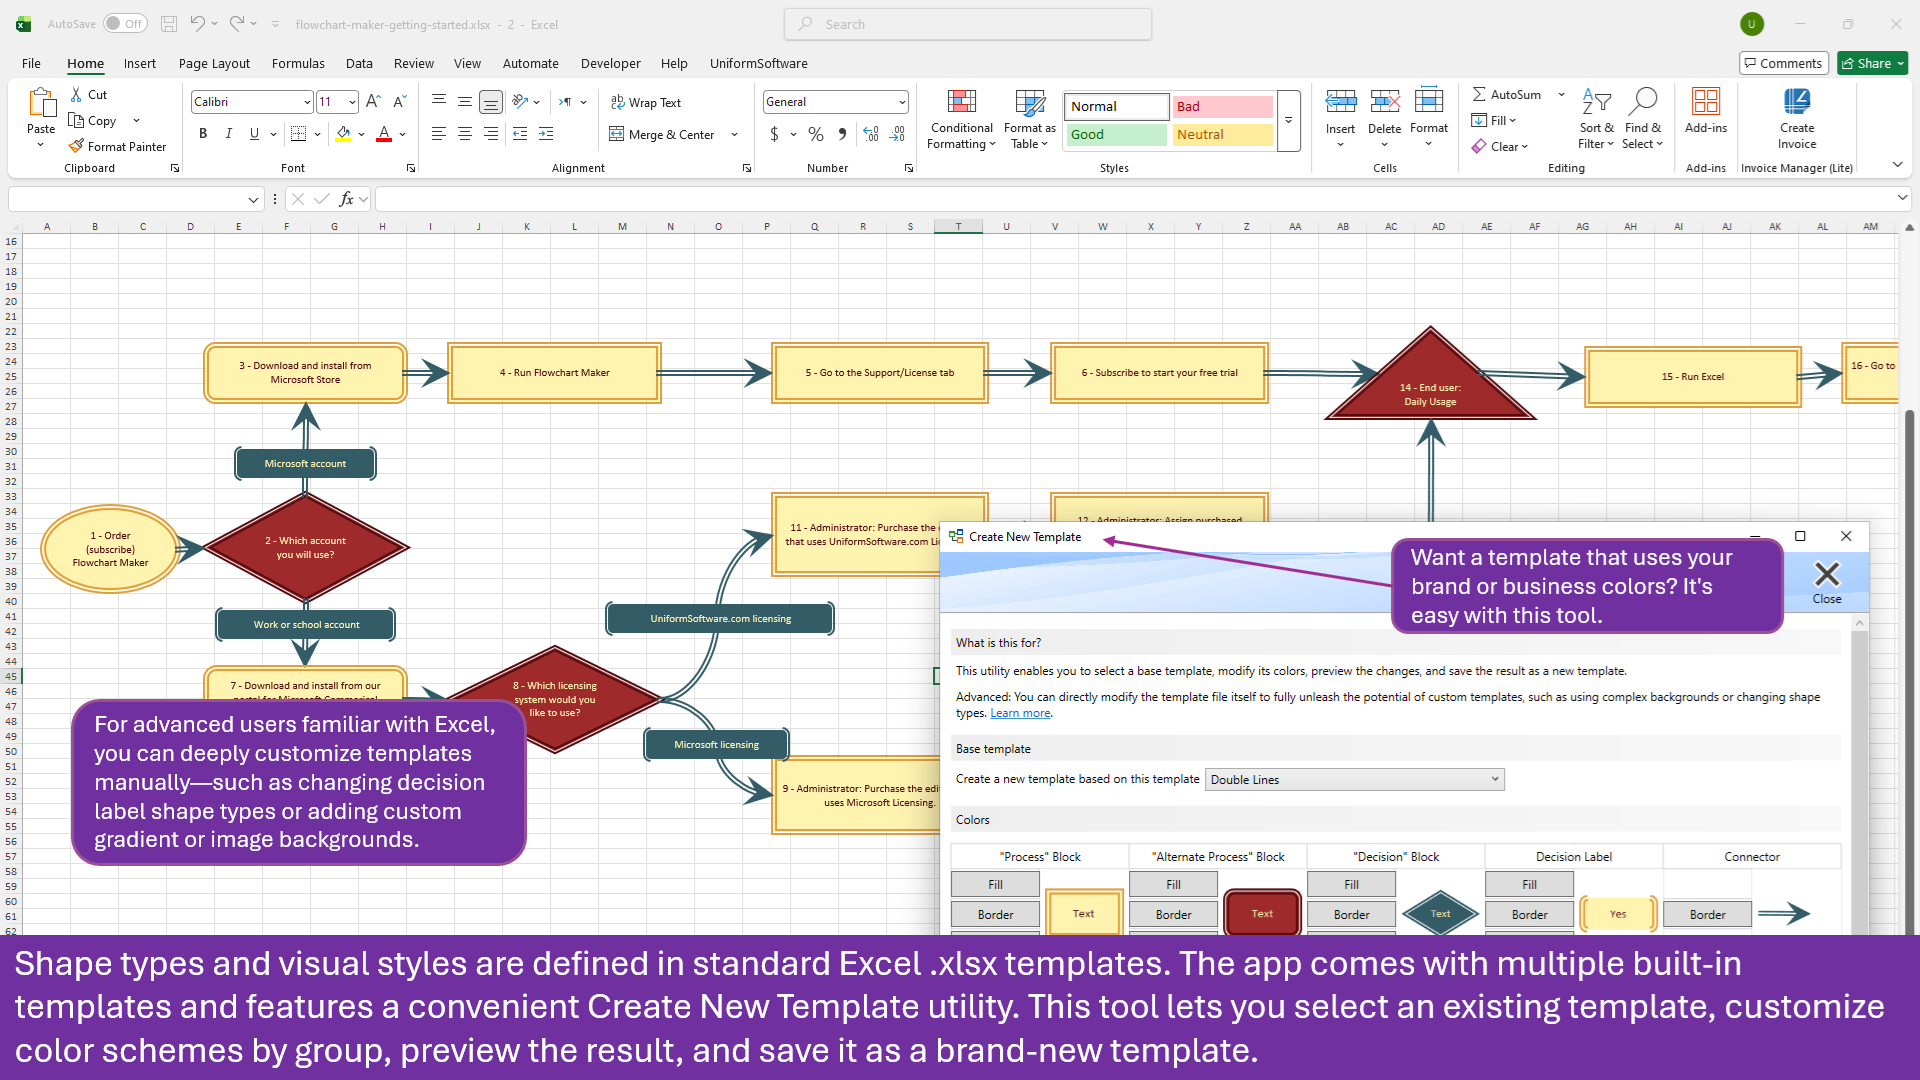
Shape types and visual styles are defined in standard Excel .xlsx template files. Switch themes instantly from the ribbon, or build a custom template using your own business or brand colors.
The app ships with multiple built-in templates. Select one from the Template drop-down on the ribbon and click Create / Update Flowchart — the entire diagram redraws in the new style with no manual reformatting. The New Template utility takes an existing template as a base, lets you change the fill, border, and text colors for each shape group, previews the result on a live test chart, and saves it as a new named template. Advanced users can edit template files directly in Excel for deeper customization such as gradient fills or custom shape types.
- One-Click Theme SwitchingChange the active template from the ribbon drop-down and redraw — see a completely different color scheme and shape style applied instantly to the same diagram.
- Create New Template with Brand ColorsUse the New Template utility to set your own RGB colors per shape group, preview a live test chart, and save the result as a reusable named template.
- Templates Are Standard Excel FilesTemplates are ordinary .xlsx workbooks — open one in Excel to make advanced changes such as gradient backgrounds, image fills, or custom decision label shape types.
Export to High-Resolution PDF or Image
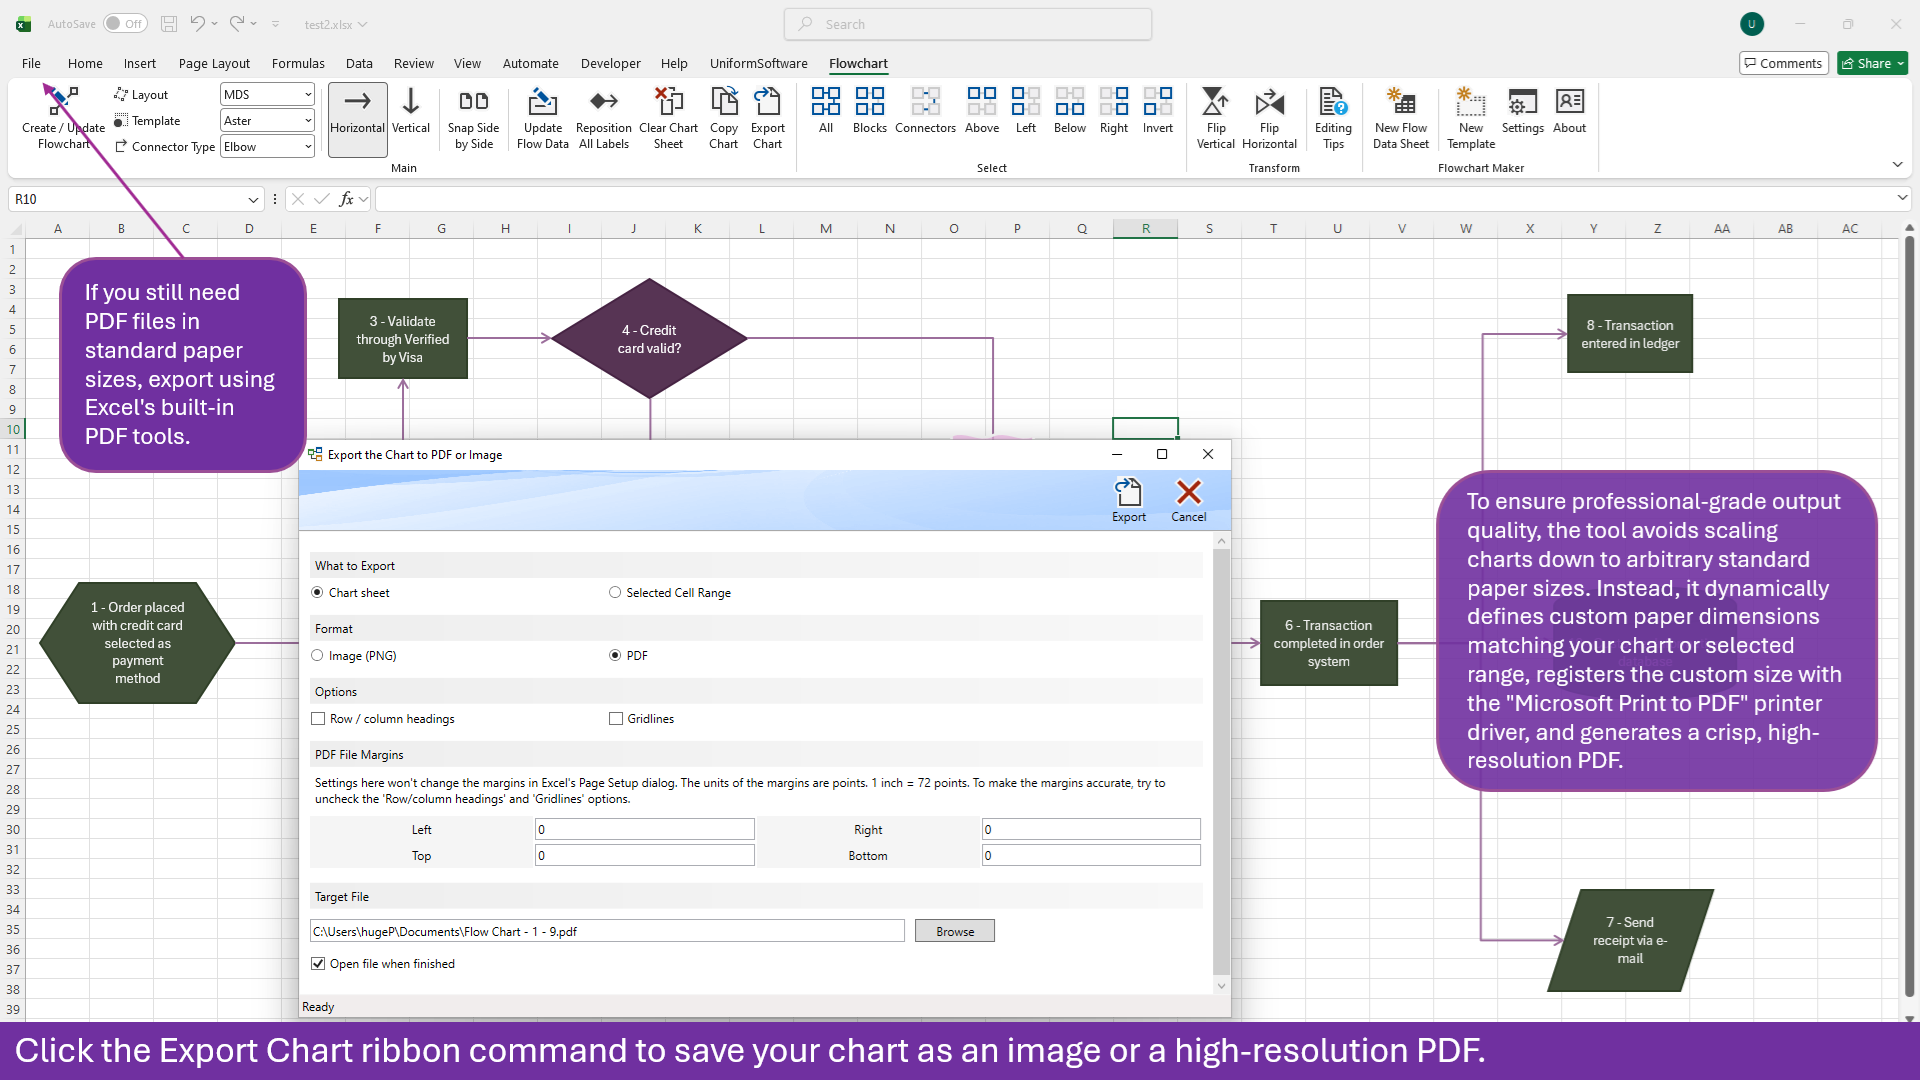
Click Export Chart on the Flowchart ribbon to save your diagram as a crisp, print-ready PDF or a PNG image — sized exactly to your chart, not to a fixed paper size.
To ensure professional-grade output, the export tool avoids scaling your chart to an arbitrary standard paper size. Instead, it dynamically defines custom paper dimensions that match your chart or selected range exactly, registers that size with the Microsoft Print to PDF printer driver, and generates a high-resolution PDF. Choose what to export — the full chart sheet or a selected cell range — and control margins, headings, and gridlines from the export dialog.
- Custom-Sized PDF OutputThe PDF page dimensions match your chart exactly — no blank borders, no forced scaling to A4 or Letter — giving you a crisp, professional result every time.
- PNG Image ExportExport as a PNG image for use in emails, wikis, presentations, or anywhere a document-independent image format is needed.
- Standard PDF as an AlternativeIf you need standard paper sizes, use Excel's built-in PDF tools directly — the flowchart, being native Excel shapes, prints perfectly through the standard Excel print path too.
Pure Excel Files — SharePoint, Teams, and OneDrive Ready
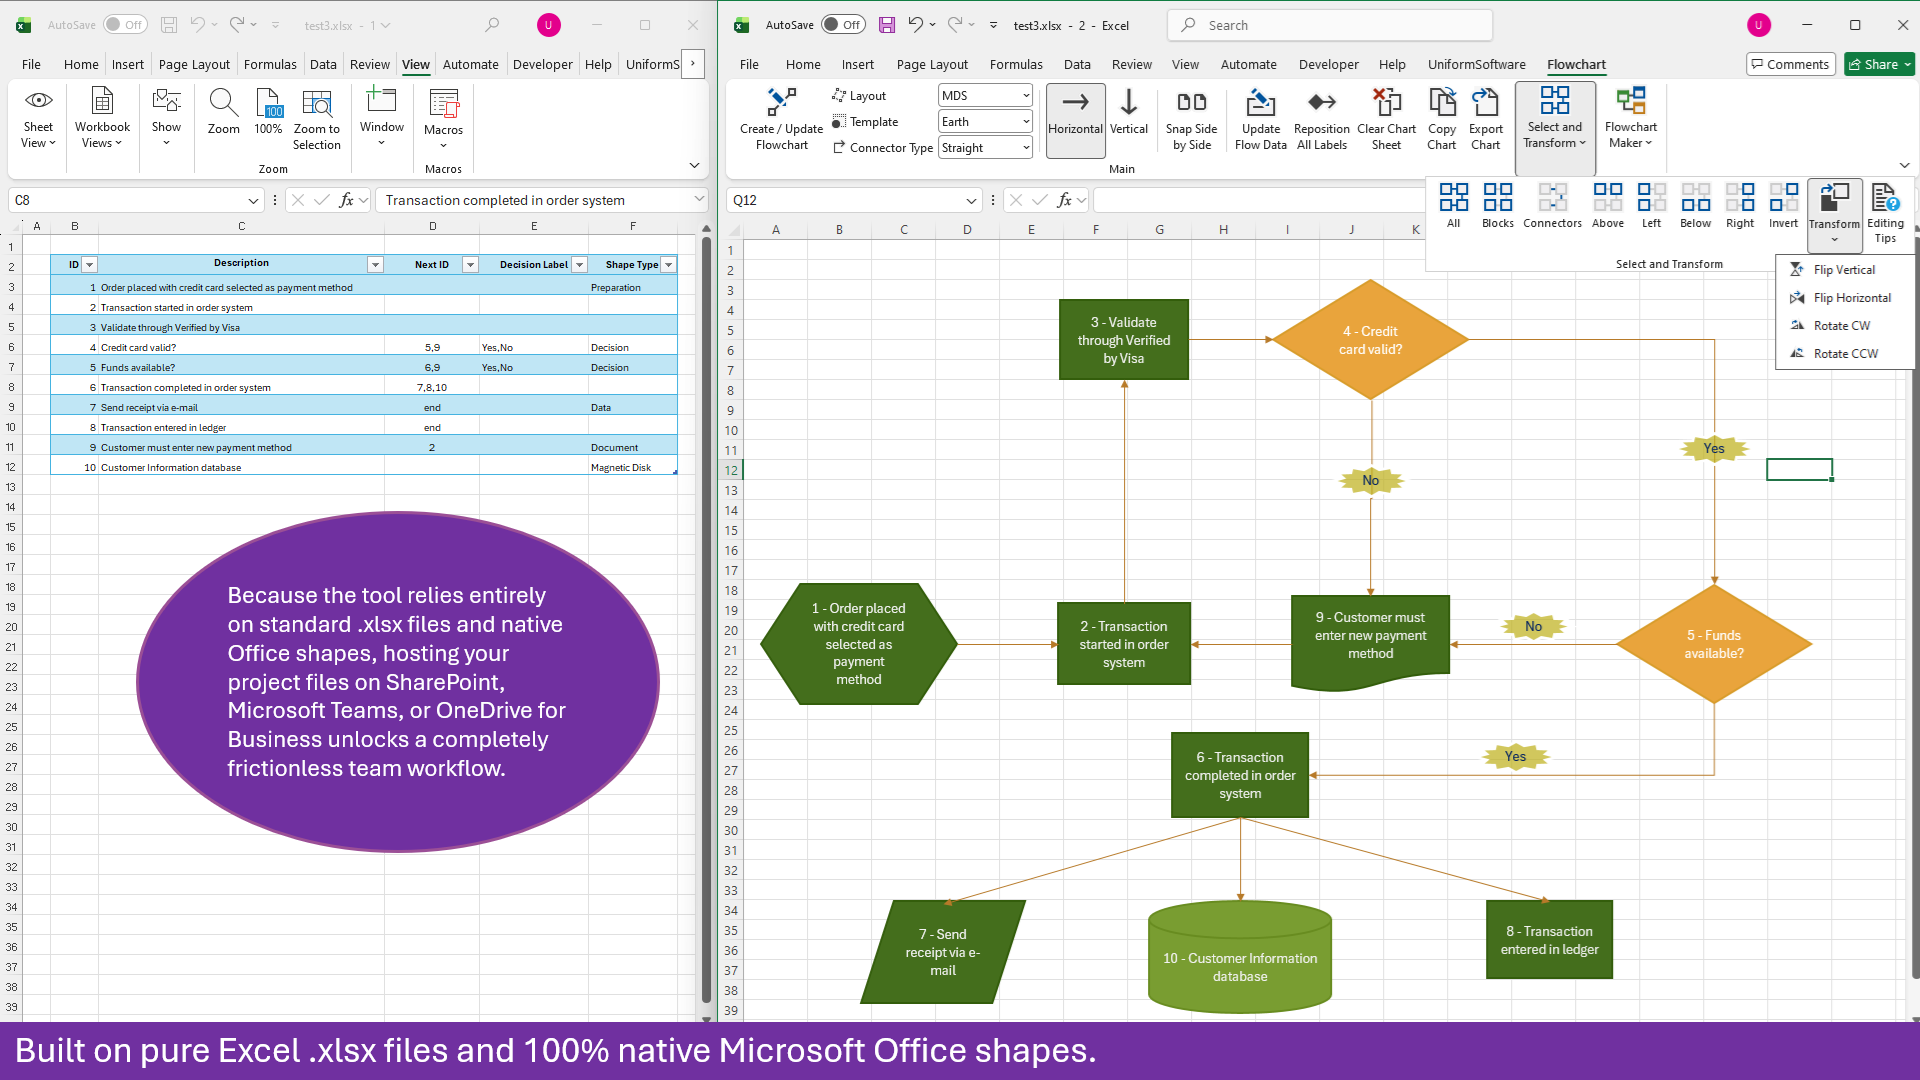
Flowchart Maker is built on 100% standard Excel .xlsx files and native Microsoft Office shapes. No proprietary formats, no external databases, no embedded binaries.
Because every flowchart project is a plain .xlsx workbook containing only native Office shapes, you can store and share it anywhere Excel files work — SharePoint, Microsoft Teams, OneDrive for Business, or a shared network drive. Co-authors can open, view, and edit the data table and the shapes in the flowchart using standard Excel without needing the add-in installed. When the add-in is present, any team member can regenerate or update the chart from the shared data table.
- No Proprietary Format Lock-inYour flowchart project is a standard .xlsx file. Open it, read it, and edit it in any version of Excel — no add-in required to view or manually edit the shapes.
- SharePoint & Teams CollaborationStore project files on SharePoint or Microsoft Teams for a completely frictionless team workflow — check-out, version history, and co-authoring all work natively.
- OneDrive Sync Across DevicesSave to OneDrive for Business and access your flowchart project from any Windows device where Excel and the add-in are installed.
More Tools for Faster Editing
A complete set of selection, transformation, and connector controls to help you polish diagrams of any size.
Smart Selection Tools
Select all shapes, blocks only, or connectors only with dedicated ribbon buttons. Select shapes Above, Below, Left, or Right of the current selection — or use Invert to flip the selection. Ideal for bulk formatting or moving large groups of nodes.
Flip & Rotate Transform
Flip the entire chart or a selected group of shapes vertically or horizontally — connectors and labels update automatically. Rotate 90 degrees clockwise or counterclockwise. Useful for reorienting a diagram to fit a different slide or document layout without rebuilding.
Connector Style Options
Choose the connector routing that suits your diagram: Auto, Straight, Curve, or Elbow (right-angle bends). Select from the ribbon drop-down — the style applies to all connectors when the chart is created or updated.
Reposition Labels
Use Reposition All Labels to snap decision branch labels back to their correct positions near their connector lines.
Frequently Asked Questions (FAQ)
Download and Subscribe
How do I choose?
- Choose Microsoft Store if you use a Microsoft account — usually for personal use.
- Choose Microsoft AppSource if you use a work or school account — usually for business and enterprise use.
Learn More about Flowchart Maker for Excel
