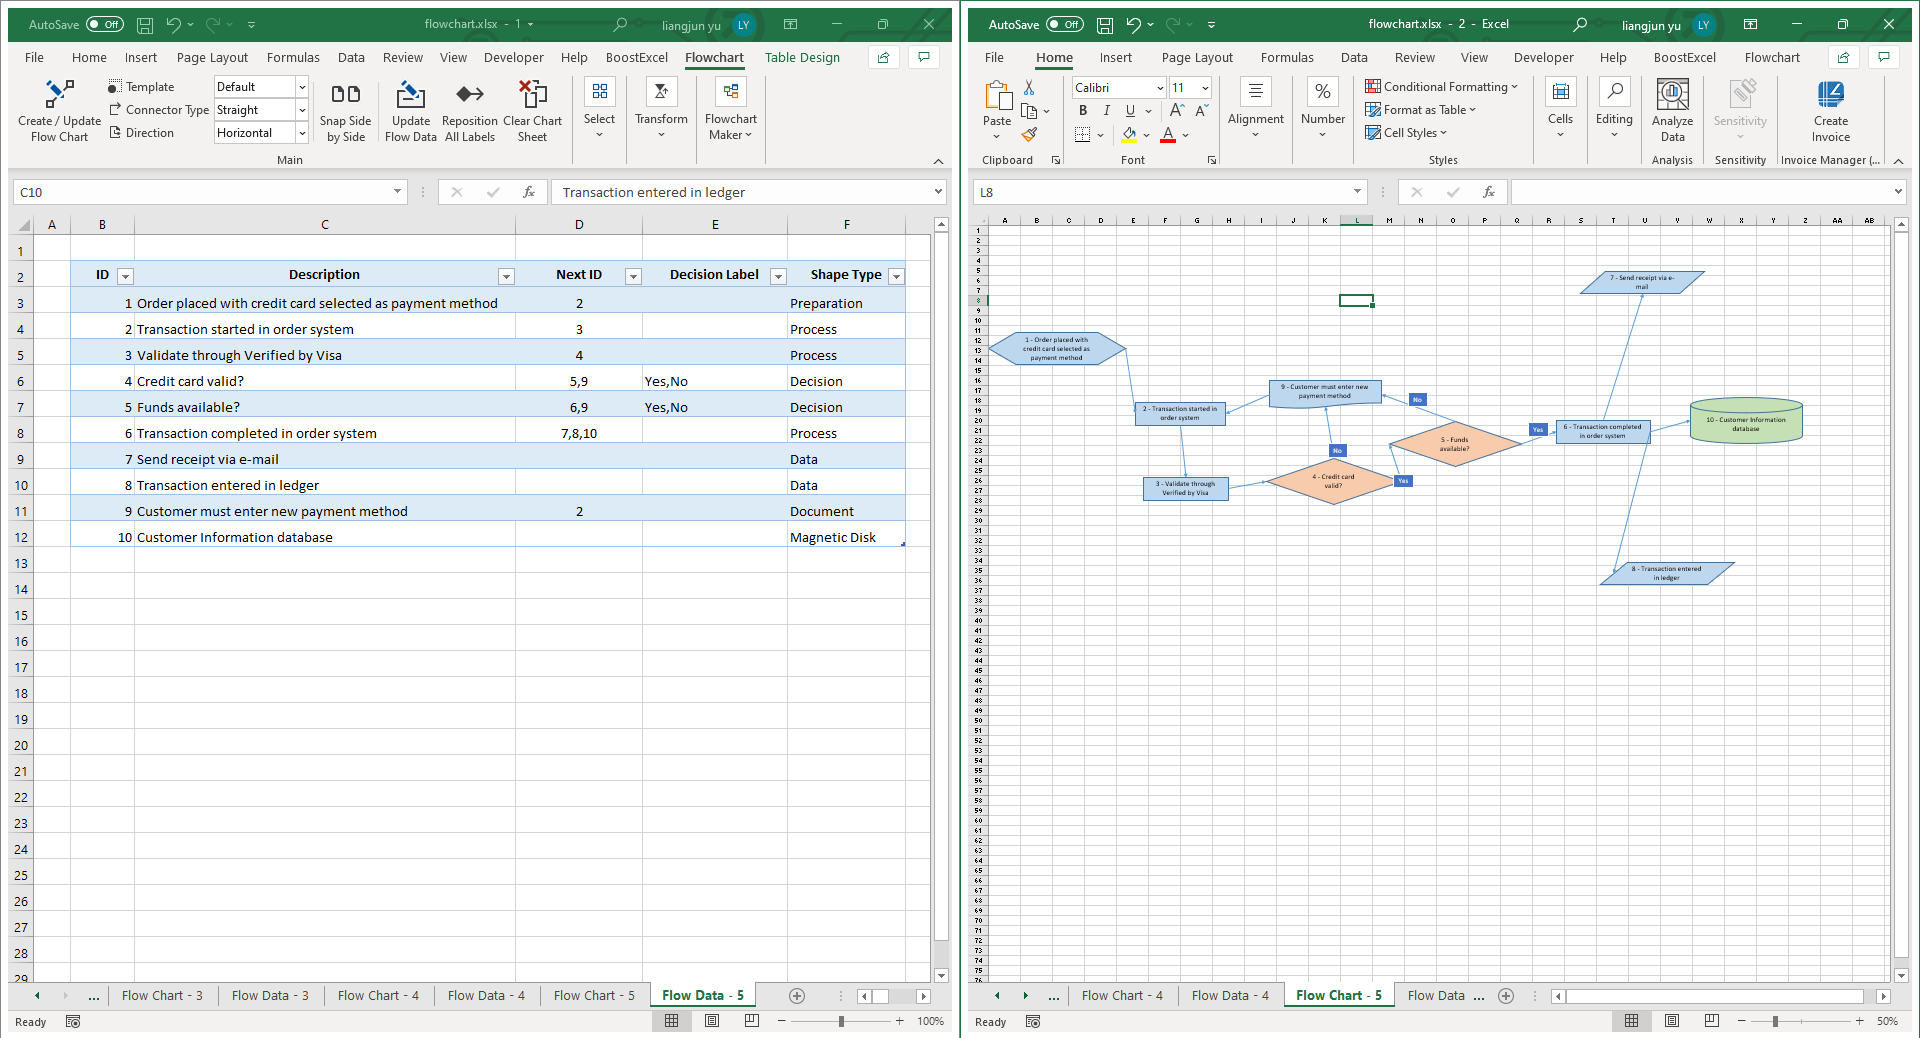
The chart created by Flowchart Maker uses only standard Excel flowchart shapes. This enables you to customize the chart by dragging and dropping the shapes.
Excel itself offers rich tools too. If you select any shape on a chart, Excel shows the "Shape Format" ribbon, where you can find various tools for customizing shapes and text. For example, you can set the shadow or 3D effects of a process step to highlight it.
Snap Data Sheet and Chart Sheet Side by Side
The two worksheets "Flow Data*" and "Flow Chart*" contain related information. If you need to switch between them frequently, try the "Snap Side by Side" command.
This command places the chart sheet and data sheet side by side on the screen. This enables you to review or work on both sheets without switching back and forth. It is extremely useful if you have a large screen.
Use Excel's "Zoom" Command
If you have a large diagram, try Excel's "Zoom" command. To access this command,
- Make sure the active sheet is a flow chart sheet.
- Go to Excel’s "View" ribbon tab.
- Choose the zoom level, or type in your custom zoom level.
- To restore 100% zoom, simply click the "100%" button on the same ribbon section.
Change Connection Site
The app uses an automated algorithm to avoid crossing connectors. But in rare cases, there are still crossing lines on the chart. Fortunately, changing the connection site could fix many of them.
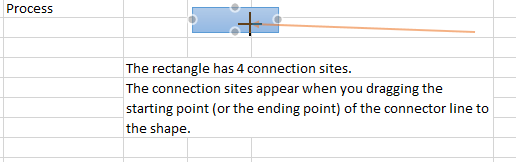
Different shape types have different numbers of sites. For example, the rectangle (flowchart shape "Process") has 4 connection sites; the "Summing Junction" shape has 8 connection sites.
To change a connection site:
- Click a connector to select it.
- Click and push down your mouse key on the starting point or the ending point of the connector. Don't release the mouse key.
- Drag the point to the target shape. The connection sites of the shape appear.
- Move your mouse to the desired connection site and release the the mouse key.
- Now the dragged point of the connector line (either the ending point or the starting point) is "connected" with the site. If you move the shape, the connected point will flow with it too.
Select One Shape
Be sure to click a location near the border of the shape. If you click the center of the shape, Excel thinks you want to edit the text and thus puts the embed text box into editing mode instead of selecting the shape.
Select Multiple Shapes
Often, you want to apply the same modification to multiple shapes, for example, by moving multiple shapes, changing the background color of multiple shapes, etc. Before doing that, you first need to select multiple shapes.
One way to do that is to use one of the "Select" commands on the "Flowchart" ribbon. For example, if you want to select "Shape A" and all the shapes to the left of the shape, you first select "Shape A", and then click the "Left" button on the "Flowchart" ribbon tab.
If this does not work for you, you can also select shapes one by one manually. To do this, simply push down the CTRL key on the keyboard and then click each shape.
With the CTRL key pushed down, clicking a selected shape will unselect it.
Align Shapes
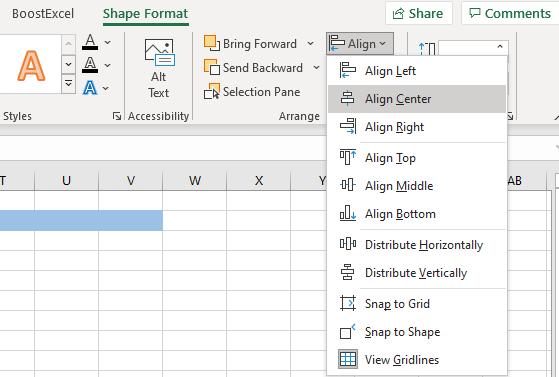
To align multiple shapes on the same row or column, first select the shapes as described above.
Then go to Excel's "Shape Format" menu and click "Align" on the "Arrange" group. Choose "Align Center" or "Align Middle" as you require.
Change Connector Type
The auto-generated shape uses the connector type selected on the ribbon option "Connector Type". Once the chart is generated, you can still change the connector types.
To do this, First select all the connectors by clicking the "Connectors" command on the "Select" group of the "Flowchart" ribbon tab, or select one or multiple connectors manually.
Then, right-click one of the selected shapes and choose "Connector Types" from the menu.
