A flowchart is a type of diagram that shows a process or workflow. A flowchart is also a diagrammatic representation of an algorithm, or a step-by-step approach to resolving issues.
The flowchart shows the steps as various types of boxes (symbols) and their order by connecting the boxes with arrows. This diagrammatic representation shows a problem solution model. Flowcharts are used in a variety of fields to analyze, design, document, or manage a process or program.
Flowcharts can be created using a variety of tools, including online diagramming tools and desktop software such as Microsoft Visio.
There are also tools that were not designed specifically for flow charts but can be used to create them, such as Google Drawings and Microsoft Excel/Word.
This means that if you already have a Microsoft 365 subscription, the tool for creating flowcharts is already available to you for free.
We'll look at how to make flow charts in Excel in this tutorial. There are two approaches: using SmartArt graphics and directly using flowchart shapes.
Making A Flowchart with Shapes
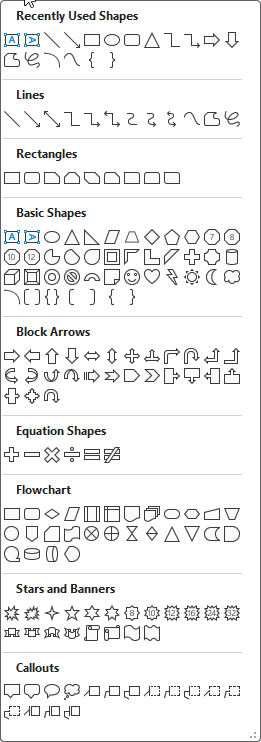
Shapes are versatile, pre-designed objects in Microsoft Office that you can insert into your documents, spreadsheets, presentations, and email messages to add visual appeal, emphasize information, and create diagrams. They are classified into several types, ranging from basic geometric shapes like squares and circles to more complex ones like stars, callouts, and flowchart symbols.
The "Flowchart" category contains 28 shapes, as detailed in the legends for flowcharts. The table below (Wikipedia) describes some common shapes as defined by The American National Standards Institute (ANSI) and ISO 5807.
| ANSI/ISO Shape | Name | Description |
 | Flowline (Arrowhead) ('Connector' in Excel) | Shows the process's order of operation. A line coming from one symbol and pointing at another. |
 | Terminal | Indicates the beginning and ending of a program or sub-process. Represented as a stadium, oval or rounded (fillet) rectangle. They usually contain the word "Start" or "End", or another phrase signaling the start or end of a process, such as "submit inquiry" or "receive product". |
 | Process | Represents a set of operations that changes value, form, or location of data. Represented as a rectangle. |
 | Decision | Shows a conditional operation that determines which one of the two paths the program will take. The operation is commonly a yes/no question or true/false test. Represented as a diamond (rhombus). |
 | Input/Output | Indicates the process of inputting and outputting data, as in entering data or displaying results. Represented as a rhomboid. |
| ... | ... | ... |
Create a grid
When creating a flowchart in Excel, you can use the worksheet grid to position and size your flowchart elements. The default cell height and width do not match. Reduce the width of the column to make it look like graph paper by following the steps below.
- Create a new worksheet.
- Select the entire sheet (all columns and rows) by clicking the triangle icon in the top-left corner of the worksheet grid.
- Hold down the mouse button on one of the column headings' borders. Resize it by dragging.
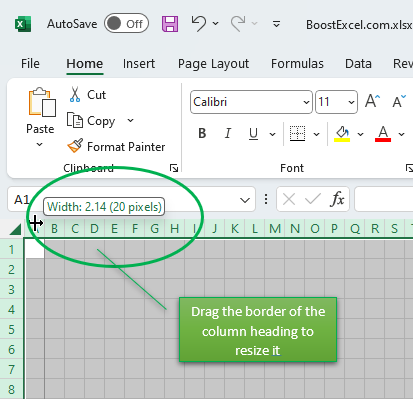
- Excel shows the width of the column in pixels when you're dragging the column border. Make sure it is 20 pixels. 20 pixels (i.e. 15 points) is the default row height in pixels if you're using the default font (Calibri, size 11).
- Release the mouse key.
- This creates a grid with equal row height and column widths.
It is also helpful to enable Snap to Grid. To do this, go to the Page Layout ribbon tab and then Align and select Snap to Grid.
Another way to quickly arrange shapes is to use the Align commands on the Shape Format tab, such as Align Left, Align Top, and Distribute Horizontally etc. See Tips and Tricks for Editing Flowcharts for more information, or see a practical example in the tutorial movie.
Create a flowchart
To create a flowchart using shapes, follow the steps below.
- Go to Excel's Insert ribbon tab.
- Pull down the Shapes list.
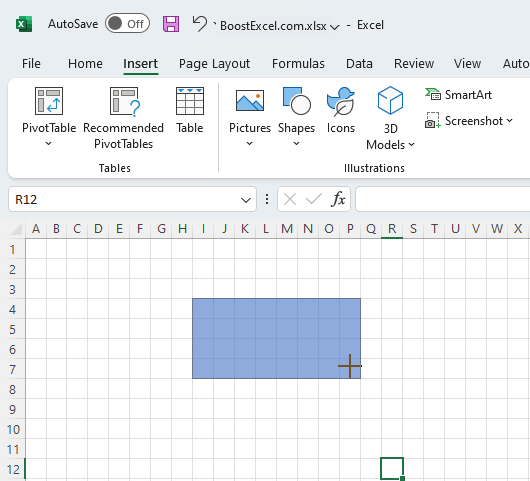
- From the Flowchart group, choose Process (rectangle)
- Draw a rectangle on the sheet. As you can see, Excel automatically snaps the borders of rectangle to gridlines.
- Repeat the above steps, draw a Decision symbol (rhombus) below the first Process shape on the sheet.
- Repeat the above steps, draw a Terminator below the decision box.
- Pull down the Shapes list again.
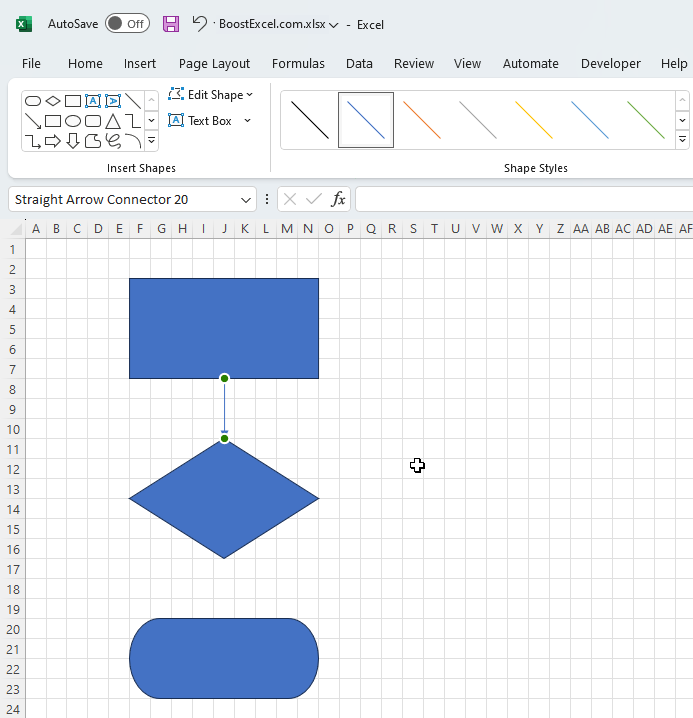
- Choose Line Arrow from the Lines group.
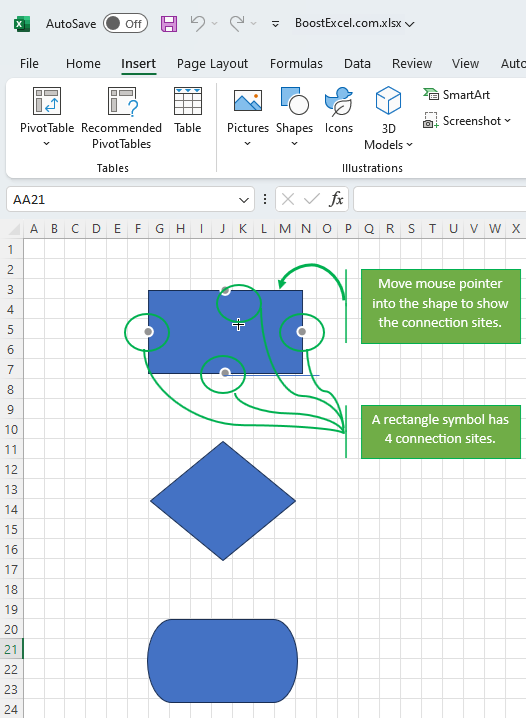
- When you move your mouse pointer to an existing shape, the shape shows connection sites. A connection site is the point where you can place the start point or end point of a connector. A rectangle symbol has 4 connection sites.
- Draw the connector from the bottom connection site of the Process node to the top connection site of the decision box.
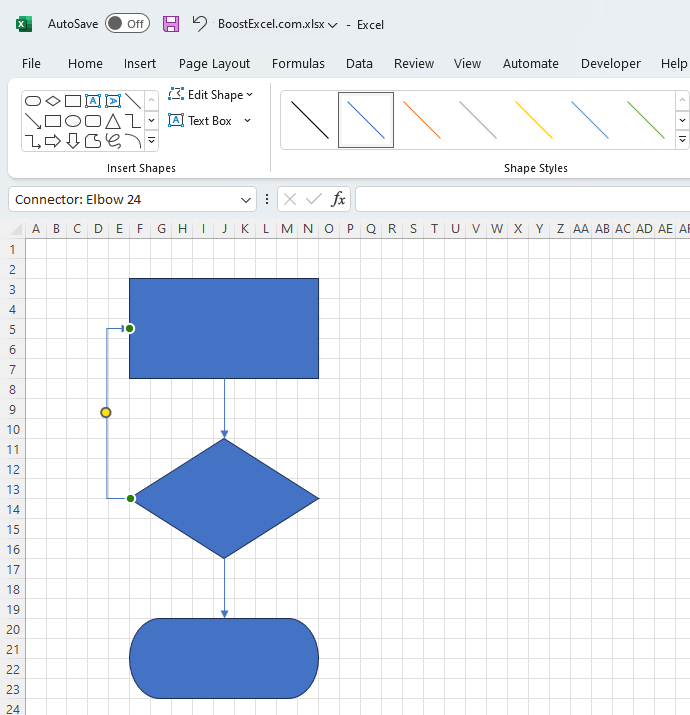
- Draw another connector from the decision node to the Terminator node.
- Draw an Elbow Arrow connector from the left side of the decision node to the Process node.
- Right-click the Process node and choose Edit Text from the menu.
- Fill in the description text, such as "Do something".
- To align text labels, go to the Home ribbon tab, push down the Middle Align and Center options in the Alignment group.
- Repeat the above steps to fill in the descriptions for the other two nodes.
- Push down the CTRL key on your keyboard.
- Click the border of the three nodes one by one. This selects the three nodes.
- Go to the Shape Format ribbon tab.
- Pull down the Shape Styles list, choose a pre-defined shape style for the nodes. You can also open the Format Shape pane by clicking the icon button in the bottom-right corner of the Shape Styles ribbon group. The Format Shapes pane offers more options, such as fill effect and line style etc.
The following figure shows the list of shape styles.

As can be seen, it works, but it is inconvenient.
Our flowchart creator for Excel operates in a unique manner. You fill out a list of steps in a table, select a shape type using an intuitive picker, and then click a button to create the entire chart. It also allows you to select and transform the shapes. The best part is that all the shapes are based on flowchart templates that define the styles you want to use. To learn how it works, watch the tutorial video.
Making A Flowchart with SmartArt Templates
SmartArt Templates are yet another option for creating flow charts. If you can find one that fits your needs, the pre-built flowchart templates make things easier.
Here is an example.
- Go to Excel Insert ribbon tab.
- Click SmartArt in the Illustrations group.
- From the left pane, choose Process.
- From the right pane, choose Chevron Accent Process.
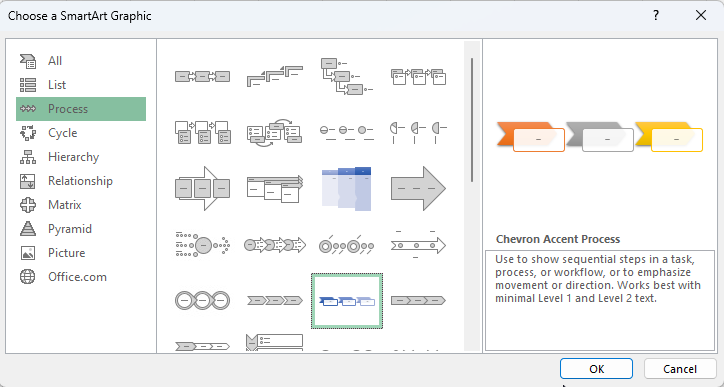
- Click OK. This adds a new flowchart to the sheet.
- Type in your description text into the "Type your text here" pane.
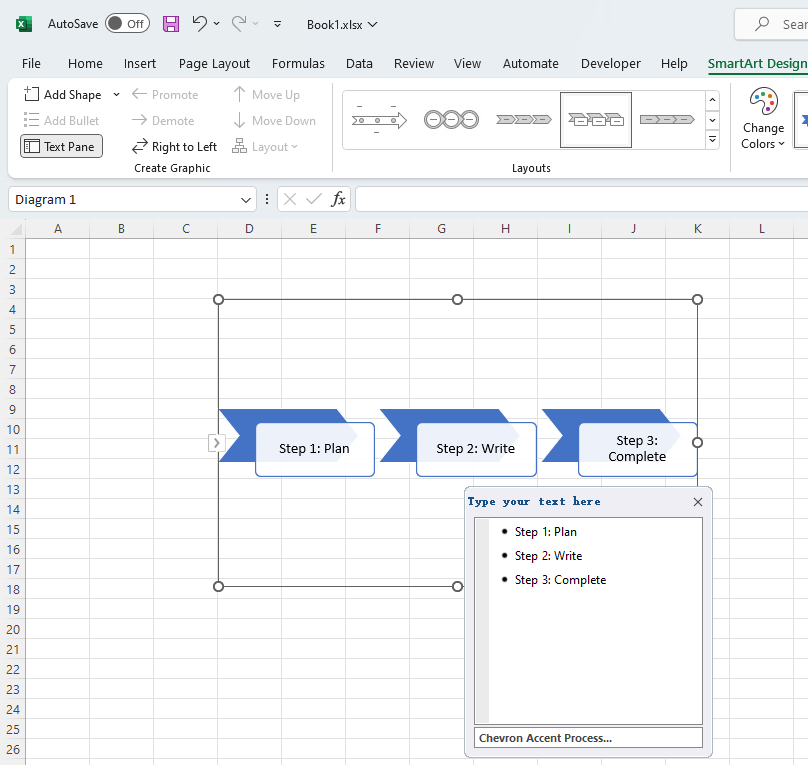
- SmartArt charts have a new SmartArt Design ribbon tab. You can change the colors or apply a SmartArt Style to your flow chart. You can also add effects, such as glows, soft edges, or 3-D effects. And in PowerPoint presentations, you can even animate your flow chart.
For example, in the SmartArt Styles group, you can easily apply the Brick Scene style .
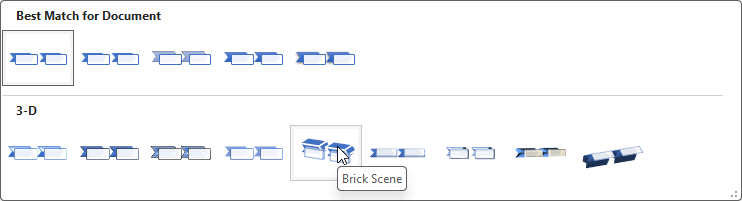
As you can see, the special SmartArt Design ribbon tab enables you to quickly add a designer-quality look and polish to your SmartArt graphic. Visit Create a flow chart with SmartArt for Microsoft's detailed tutorial. It's great for quick edits where you don't have to personalize your flowchart much.
SmartArt is available in Word and PowerPoint too. You can even copy a flowchart created in one app to another.
Conclusion
The SmartArt graphic can create beautiful charts, but it does not always use standard symbols (i.e., flowchart node shapes). In contrast, our flowchart add-in for Excel always employs standard flowchart symbols. It supports all of Excel/Office's 28 flowchart symbols.
Download the flowchart sample created in this tutorial.
